Route Profile
In this guide you will learn how to display a map, calculate routes between multiple points, and show a detailed route profile.
How it Works
This example demonstrates the following key features:
- Calculates routes and renders them on the map.
- Renders the route on a map, including alternative or multiple routes (if available).
- Provides interactive profile insights: elevation changes, slope/climbs, road & surface types.
- Lets you filter or highlight specific attributes (e.g. steepness, surface) and see how those segments behave both graphically (chart) and geographically (on the map).
UI and Map Integration
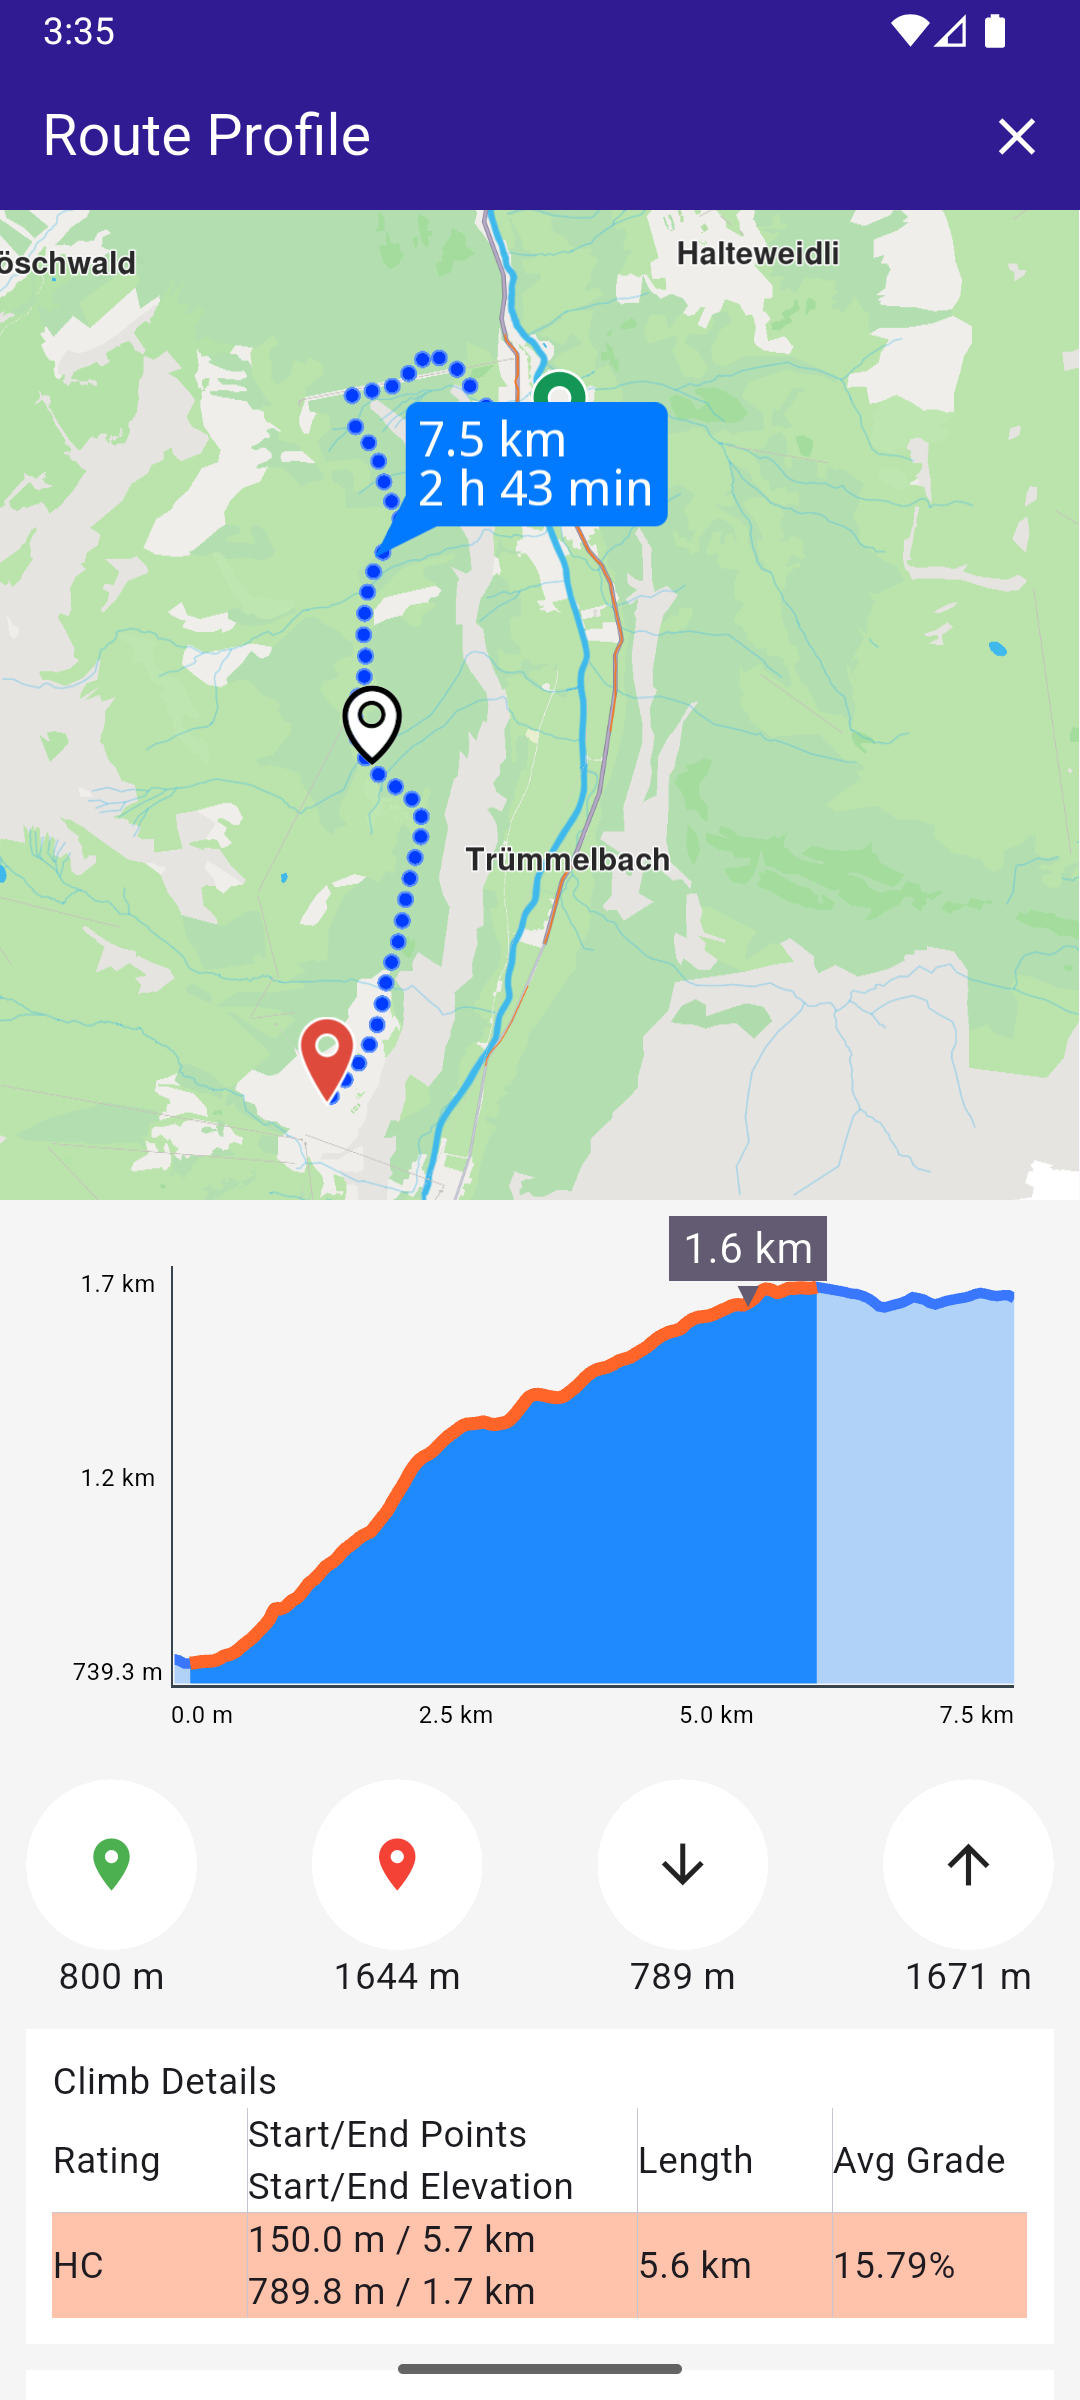
The following code demonstrates how to create a UI with a GemMap and an app bar featuring a "Build Route" button. After the route is calculated, a scrollable route profile panel appears at the bottom of the screen, along with a close button in the top-right corner of the app bar.
void main() {
  runApp(const MyApp());
}

class MyApp extends StatelessWidget {
  const MyApp({super.key});

  @override
  Widget build(BuildContext context) {
    return const MaterialApp(debugShowCheckedModeBanner: false, title: 'Route Profile', home: MyHomePage());
  }
}

class MyHomePage extends StatefulWidget {
  const MyHomePage({super.key});

  @override
  State<MyHomePage> createState() => _MyHomePageState();
}

class _MyHomePageState extends State<MyHomePage> {
  late GemMapController _mapController;

  // We use the handler to cancel the route calculation.
  TaskHandler? _routingHandler;

  Route? _focusedRoute;

  final ElevationChartController _chartController = ElevationChartController();

  @override
  void dispose() {
    GemKit.release();
    super.dispose();
  }

  @override
  Widget build(BuildContext context) {
    return Scaffold(
      appBar: AppBar(
        backgroundColor: Colors.deepPurple[900],
        title: const Text('Route Profile', style: TextStyle(color: Colors.white)),
        actions: [
          // Routes are not built.
          if (_routingHandler == null && _focusedRoute == null)
            IconButton(
              onPressed: () => _onBuildRouteButtonPressed(context),
              icon: const Icon(Icons.route, color: Colors.white),
            ),
          // Routes calculating is in progress.
          if (_routingHandler != null)
            IconButton(
              onPressed: () => _onCancelRouteButtonPressed(),
              icon: const Icon(Icons.stop, color: Colors.white),
            ),
          // Routes calculating is finished.
          if (_focusedRoute != null)
            IconButton(
              onPressed: () => _onClearRoutesButtonPressed(),
              icon: const Icon(Icons.clear, color: Colors.white),
            ),
        ],
      ),
      body: Stack(
        children: [
          GemMap(key: ValueKey("GemMap"), onMapCreated: _onMapCreated, appAuthorization: projectApiToken),
          if (_focusedRoute != null)
            Align(
              alignment: Alignment.bottomCenter,
              child: RouteProfilePanel(
                route: _focusedRoute!,
                mapController: _mapController,
                chartController: _chartController,
                centerOnRoute: () => _centerOnRoute([_focusedRoute!]),
              ),
            ),
        ],
      ),
    );
  }

  // The callback for when map is ready to use.
  Future<void> _onMapCreated(GemMapController controller) async {
    // Save controller for further usage.
    _mapController = controller;

    // Register route tap gesture callback.
    await _registerRouteTapCallback();
  }

  void _onBuildRouteButtonPressed(BuildContext context) {
    // Define the departure.
    final departureLandmark = Landmark.withLatLng(latitude: 46.59344, longitude: 7.91069);

    // Define the destination.
    final destinationLandmark = Landmark.withLatLng(latitude: 46.55945, longitude: 7.89293);

    // Define the route preferences.
    // Terrain profile has to be enabled for this example to work.
    final routePreferences = RoutePreferences(
      buildTerrainProfile: const BuildTerrainProfile(enable: true),
      transportMode: RouteTransportMode.pedestrian,
    );

    _showSnackBar(context, message: "The route is being calculated.");

    // Calling the calculateRoute SDK method.
    // (err, results) - is a callback function that gets called when the route computing is finished.
    // err is an error enum, results is a list of routes.

    _routingHandler = RoutingService.calculateRoute([departureLandmark, destinationLandmark], routePreferences, (
      err,
      routes,
    ) {
      // If the route calculation is finished, we don't have a progress listener anymore.
      _routingHandler = null;
      ScaffoldMessenger.of(context).clearSnackBars();

      // If there aren't any errors, we display the routes.
      if (err == GemError.success) {
        // Get the routes collection from map preferences.
        final routesMap = _mapController.preferences.routes;

        // Display the routes on map.
        for (final route in routes) {
          routesMap.add(route, route == routes.first, label: getMapLabel(route));
        }

        // Center the camera on routes.
        _centerOnRoute(routes);
        setState(() {
          _focusedRoute = routes.first;
        });
      }
    });

    setState(() {});
  }

  void _onClearRoutesButtonPressed() {
    _mapController.preferences.paths.clear();

    // Remove the routes from map.
    _mapController.preferences.routes.clear();

    setState(() {
      _focusedRoute = null;
    });
  }

  void _onCancelRouteButtonPressed() {
    // If we have a progress listener we cancel the route calculation.
    if (_routingHandler != null) {
      RoutingService.cancelRoute(_routingHandler!);

      setState(() {
        _routingHandler = null;
      });
    }
  }

  // In order to be able to select an alternative route, we have to register the route tap gesture callback.
  Future<void> _registerRouteTapCallback() async {
    // Register the generic map touch gesture.
    _mapController.registerOnTouch((pos) async {
      // Select the map objects at gives position.
      await _mapController.setCursorScreenPosition(pos);

      // Get the selected routes.
      final routes = _mapController.cursorSelectionRoutes();

      // If there is  a route at position, we select it as the main one on the map.
      if (routes.isNotEmpty) {
        _mapController.preferences.routes.mainRoute = routes.first;

        // Reset the highlight on the chart.
        if (_chartController.setCurrentHighlight != null) {
          _chartController.setCurrentHighlight!(0);
        }

        setState(() {
          _focusedRoute = routes.first;
        });

        // Center the camera on the main route.
        _centerOnRoute([_focusedRoute!]);
      }
    });
  }

  void _centerOnRoute(List<Route> route) {
    const appbarHeight = 50;
    const padding = 20;

    // Use the map controller to center on route above the panel.
    _mapController.centerOnRoutes(
      routes: route,
      screenRect: Rectangle<int>(
        0,
        (appbarHeight + padding * MediaQuery.of(context).devicePixelRatio).toInt(),
        (MediaQuery.of(context).size.width * MediaQuery.of(context).devicePixelRatio).toInt(),
        ((MediaQuery.of(context).size.height / 2 -
                    appbarHeight -
                    2 * padding * MediaQuery.of(context).devicePixelRatio) *
                MediaQuery.of(context).devicePixelRatio)
            .toInt(),
      ),
    );
  }

    // Show a snackbar indicating that the route calculation is in progress.
  void _showSnackBar(BuildContext context, {required String message, Duration duration = const Duration(hours: 1)}) {
    final snackBar = SnackBar(content: Text(message), duration: duration);

    ScaffoldMessenger.of(context).showSnackBar(snackBar);
  }
}

String getMapLabel(Route route) {
  return '${convertDistance(route.getTimeDistance().totalDistanceM)} \n${convertDuration(route.getTimeDistance().totalTimeS)}';
}
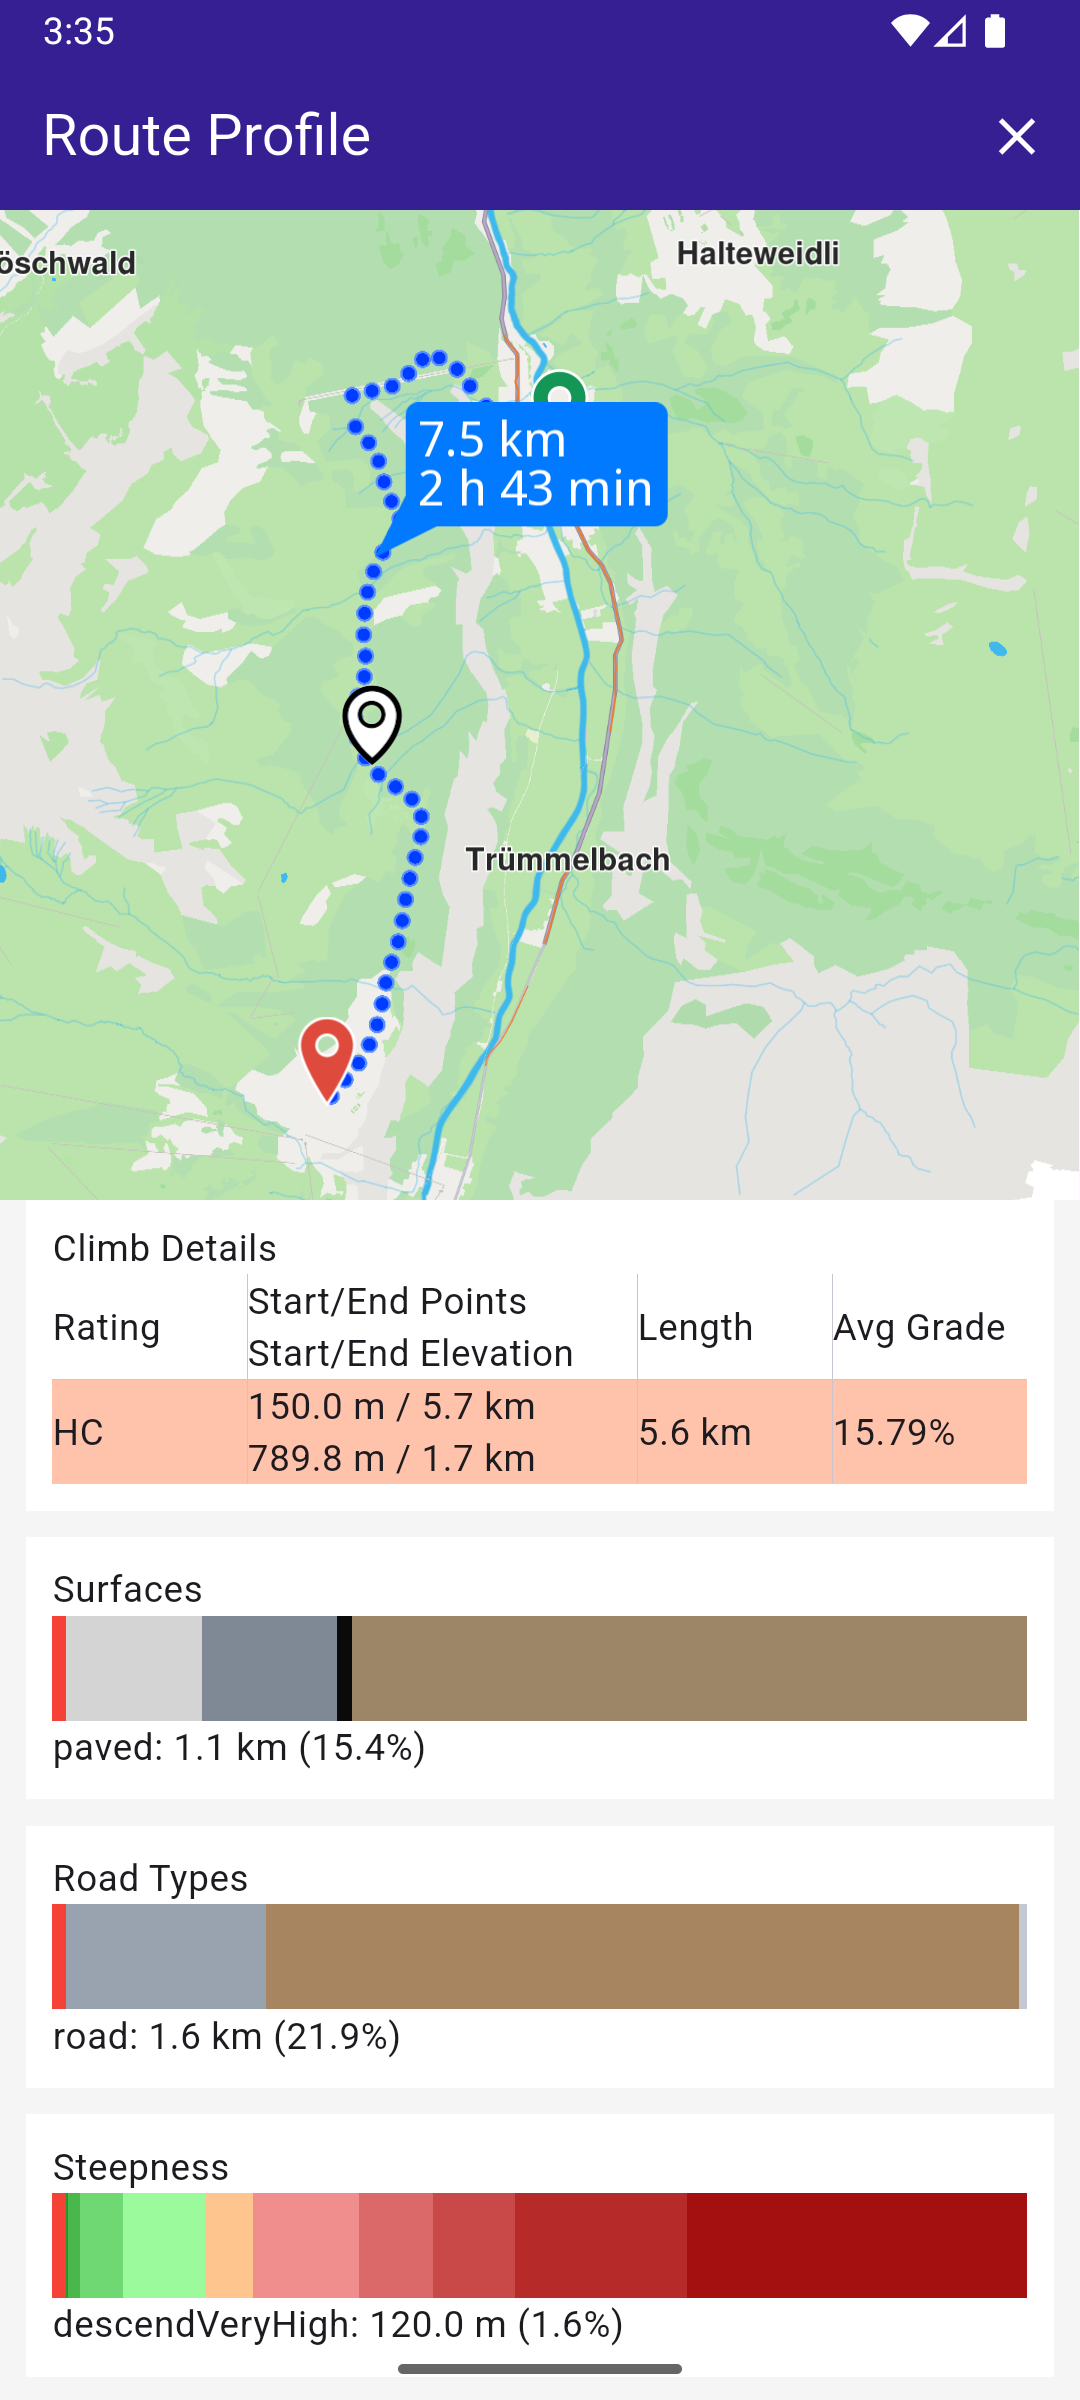
Steepness Classification
The Magic Lane SDK allows you to analyze the slope of a route by dividing it into segments of varying steepness.
This is especially useful for hiking and cycling apps where slope difficulty is a critical factor.
Steepness in the Example
In the example project, we define a Steepness enum to make slope information easier to interpret and display.
enum Steepness {
  descendExtreme,
  descendVeryHigh,
  descendHigh,
  descendLow,
  descendVeryLow,
  neutral,
  ascendVeryLow,
  ascendLow,
  ascendHigh,
  ascendVeryHigh,
  ascendExtreme,
}
This enum provides user-friendly labels for slope categories.
It covers both descending and ascending gradients, with neutral representing nearly flat terrain.
- Descending categories → from
descendExtreme(very steep downhill) todescendVeryLow(slight downhill). - Neutral → flat or almost flat terrain.
- Ascending categories → from
ascendVeryLow(gentle uphill) toascendExtreme(very steep uphill).
In the example, these values are mapped to slope thresholds (defined when calling getSteepSections) and also assigned colors for visualization in charts or maps.
For instance:
- Steep downhills are mapped to shades of green.
- Neutral terrain is shown in orange.
- Steep uphills are mapped to shades of red.
This way, the elevation chart and route visualization become intuitive: the color directly reflects how hard the climb or descent is.
Example Mapping
Using the example categs above:
- Slopes
< -16%→descendExtreme - Between
-10%and-7%→descendHigh - Between
4%and7%→ascendLow - Slopes
> 16%→ascendExtreme
This allows custom flexibility: you can tune the thresholds to your application's needs (e.g., more sensitive slope categories for mountain biking vs. walking).
Climb Details
The example project also includes a Climb Details panel.
This widget takes a calculated route and shows a breakdown of its climb segments in a structured table.
class ClimbDetails extends StatelessWidget {
  final Route route;
  const ClimbDetails({super.key, required this.route});

  @override
  Widget build(BuildContext context) {
    return Container(
      color: Colors.white,
      padding: const EdgeInsets.all(10.0),
      child: Column(
        crossAxisAlignment: CrossAxisAlignment.start,
        children: [
          const Text('Climb Details'),
          Table(
            border: TableBorder(
              verticalInside: BorderSide(
                width: 0.5,
                color: Theme.of(context).colorScheme.outlineVariant,
                style: BorderStyle.solid,
              ),
              horizontalInside: BorderSide(
                width: 0.5,
                color: Theme.of(context).colorScheme.outlineVariant,
                style: BorderStyle.solid,
              ),
            ),
            defaultVerticalAlignment: TableCellVerticalAlignment.middle,
            columnWidths: const {
              0: FlexColumnWidth(1),
              1: FlexColumnWidth(2),
              2: FlexColumnWidth(1),
              3: FlexColumnWidth(1),
            },
            children: [
              const TableRow(
                children: [
                  Text('Rating'),
                  Text("Start/End Points\\nStart/End Elevation", maxLines: 2),
                  Text("Length", maxLines: 1),
                  Text("Avg Grade", maxLines: 2),
                ],
              ),
              for (final section in route.terrainProfile!.climbSections)
                TableRow(
                  decoration: BoxDecoration(color: getGradeColor(section)),
                  children: [
                    Text(_getGradeString(section.grade)),
                    Text(
                      '\${convertDistance(section.startDistanceM.toDouble())} / \${convertDistance(section.endDistanceM.toDouble())}\\n\${convertDistance(_getSectionStartElevation(section))} / \${convertDistance(_getSectionEndElevation(section))}',
                      maxLines: 2,
                    ),
                    Text(
                      convertDistance(
                        (section.endDistanceM - section.startDistanceM).toDouble(),
                      ),
                      maxLines: 2,
                    ),
                    Text("\${section.slope.toStringAsFixed(2)}%", maxLines: 2),
                  ],
                ),
            ],
          ),
        ],
      ),
    );
  }

  double _getSectionStartElevation(ClimbSection section) {
    return route.terrainProfile!.getElevation(section.startDistanceM);
  }

  double _getSectionEndElevation(ClimbSection section) {
    return route.terrainProfile!.getElevation(section.endDistanceM);
  }

  String _getGradeString(Grade grade) {
    switch (grade) {
      case Grade.grade1: return "1";
      case Grade.grade2: return "2";
      case Grade.grade3: return "3";
      case Grade.grade4: return "4";
      case Grade.gradeHC: return "HC";
    }
  }
}
How It Works
- Input → the widget takes a
Routewith a populatedterrainProfile. - Loop → for each
ClimbSection, a row is added to the table. - Color → each row background is set with
getGradeColor(section), giving a visual cue for difficulty. - Columns shown:
- Rating → the climb’s grade (1–4 or HC).
- Start/End Points & Elevation → distance along the route and elevation values.
- Length → climb distance.
- Avg Grade → average slope percentage.
This table complements the elevation chart by giving precise numeric details:
- Cyclists can check how long and steep each climb is.
- Hikers can quickly see elevation gain across segments.
- The color-coded difficulty helps users identify the toughest sections at a glance.
Elevation Chart
The ElevationChart is the interactive visualization at the heart of the route profile.
It plots the elevation of the route, highlights climb sections, and supports rich interactions like zooming, panning, and tooltips.
Features
- Line + Area Chart → powered by
fl_chart, showing elevation along distance. - Colored intervals → climb segments are highlighted using
getGradeColor, so users see difficulty at a glance. - Interactive gestures:
- One-finger drag → move the highlight cursor.
- Two-finger drag → pan left/right.
- Pinch → zoom horizontally on the elevation axis.
- Tooltip → shows the elevation at the highlighted position.
- Custom axes → left Y-axis for elevation, bottom X-axis for distance.
class ElevationChartController {
void Function(double)? setCurrentHighlight;
void Function(double, double)? changeViewport;
}
class ElevationChart extends StatefulWidget {
final void Function(double leftX, double rightX)? onViewPortChanged;
final void Function(double x)? onSelect;
final ElevationChartController controller;
late final double maxY;
late final double minY;
late final double maxX;
late final double minX;
static const double leftLabelBarWidth = 40;
static const double bottomLabelBarHeight = 20;
static const double tooptipWidth = 60;
late final List<FlSpot> spots;
final List<(List<FlSpot>, Color)> highlightedIntervals = [];
final List<(double, double, Color)> highlightedColoredIntervals = [];
final List<ClimbSection> climbSections;
final Color legendLabelColor;
final Color? indicatorColor;
final bool isInteractive;
ElevationChart({
super.key,
required this.controller,
required List<(double, double)> points,
required this.climbSections,
this.onSelect,
this.onViewPortChanged,
this.legendLabelColor = Colors.black,
this.indicatorColor,
this.isInteractive = true,
}) {
spots = points.map((e) => FlSpot(e.dart, e.)).toList();
if (spots.isEmpty) {
maxY = 0;
minY = 0;
maxX = 0;
minX = 0;
} else {
maxY = spots.map((e) => e.y).reduce(max) + 50;
minY = spots.map((e) => e.y).reduce(min) - 50;
maxX = spots.map((e) => e.x).reduce(max);
minX = spots.map((e) => e.x).reduce(min);
}
for (var climbSection in climbSections) {
final Color highligthedColor = getGradeColor(climbSection).withAlpha(255);
highlightedColoredIntervals.add((
climbSection.startDistanceM.toDouble(),
climbSection.endDistanceM.toDouble(),
highligthedColor,
));
}
for (final interval in highlightedColoredIntervals) {
final intervalStart = interval.dart;
final intervalEnd = interval.;
final intervalColor = interval.$3;
final affectedSpots = spots
.where(
(element) => element.x >= intervalStart && element.x <= intervalEnd,
)
.toList();
highlightedIntervals.add((affectedSpots, intervalColor));
}
}
void setCurrentHighlight(double value) {
state._setCurrentHighlight(value);
}
// ignore: library_private_types_in_public_api
late final _LineAreaChartState state;
@override
// ignore: no_logic_in_create_state
State<ElevationChart> createState() {
state = _LineAreaChartState();
return state;
}
}
class _LineAreaChartState extends State<ElevationChart> {
late double _currentLeftX;
late double _currentRightX;
double get _currentSectionLength => _currentRightX - _currentLeftX;
double get _currentMiddleX => (_currentLeftX + _currentRightX) * 0.5;
FlSpot? _currentSpot;
double? get _currentHighlightX => _currentSpot?.x;
double? get _currentHighlightY => _currentSpot?.y;
int _timestampLastTwoFingersGesture = 0;
int _timestampLastScaleGesture = 0;
double _scaleOriginXMovingAverage = 0;
Timer? _timerUntilOnViewportUpdate;
_ViewportController viewportController = _ViewportController();
_TooltipController tooltipController = _TooltipController();
_TitleBarController titleBarController = _TitleBarController();
@override
void initState() {
super.initState();
resetMarginsAndHighlight();
}
@override
void didUpdateWidget(covariant ElevationChart oldWidget) {
super.didUpdateWidget(oldWidget);
resetMarginsAndHighlight();
}
void resetMarginsAndHighlight() {
_currentLeftX = widget.minX;
_currentRightX = widget.maxX;
widget.controller.setCurrentHighlight = _setCurrentHighlight;
widget.controller.changeViewport = _updatePresentedDomainLimits;
viewportController.changeViewport(_currentLeftX, _currentRightX);
titleBarController.horizontalAxisViewportChanged(
_currentLeftX,
_currentRightX,
);
titleBarController.verticalAxisViewportChanged(widget.minY, widget.maxY);
}
void _setCurrentHighlight(double value) {
if ((value - (_currentHighlightX ?? double.infinity)).abs() <
_currentSectionLength * 0.03 &&
widget.isInteractive) {
return;
}
if (!mounted) return;
FlSpot closestSpot = widget.spots.first;
for (final spot in widget.spots) {
if ((closestSpot.x - value).abs() > (spot.x - value).abs()) {
closestSpot = spot;
}
}
if (_currentSpot != null && _currentSpot!.x == closestSpot.x) return;
_currentSpot = closestSpot;
tooltipController.setHighlight(_currentSpot);
widget.onSelect?.call(closestSpot.x);
}
void _updatePresentedDomainLimits(double newMinX, double newMaxX) {
_currentLeftX = newMinX;
_currentRightX = newMaxX;
viewportController.changeViewport(_currentLeftX, _currentRightX);
titleBarController.horizontalAxisViewportChanged(
_currentLeftX,
_currentRightX,
);
tooltipController.triggerRebuild();
if (widget.onViewPortChanged == null) return;
_timerUntilOnViewportUpdate?.cancel();
_timerUntilOnViewportUpdate = Timer(const Duration(milliseconds: 200), () {
widget.onViewPortChanged!(_currentLeftX, _currentRightX);
});
}
void _moveMiddleTowardsX(double x) {
final leftXWhenXInMiddle = x - _currentSectionLength * 0.5;
final rightXWhenXInMiddle = x + _currentSectionLength * 0.5;
const lerpCoefficient = 0.01;
final newLeftXInterpolated =
_currentLeftX * (1 - lerpCoefficient) +
leftXWhenXInMiddle * lerpCoefficient;
final newRightXInterpolated =
_currentRightX * (1 - lerpCoefficient) +
rightXWhenXInMiddle * lerpCoefficient;
_updatePresentedDomainLimits(newLeftXInterpolated, newRightXInterpolated);
}
double _getXAtWidthPercentage(double widthPercentage) {
return _currentSectionLength * widthPercentage + _currentLeftX;
}
double _getTooltipXOffset(double widgetWidth) {
return (_currentHighlightX! - _currentLeftX) /
(_currentRightX - _currentLeftX) *
widgetWidth -
ElevationChart.tooptipWidth / 2;
}
double _getTooltipYOffset(double widgetHeight) {
return (_currentHighlightY! - widget.minY) /
(widget.maxY - widget.minY) *
widgetHeight;
}
@override
Widget build(BuildContext context) {
return ConstrainedBox(
constraints: const BoxConstraints(minWidth: 0, minHeight: 0),
child: AspectRatio(
aspectRatio: 2,
child: Column(
children: [
Expanded(
child: Row(
children: [
_LeftTitleBar(
originalMinY: widget.minY,
originalMaxY: widget.maxY,
intervalsCount: 3,
bottomOffset: 0,
barWidth: ElevationChart.leftLabelBarWidth,
textColor: widget.legendLabelColor,
controller: titleBarController,
),
Expanded(
child: _ChartGestureDetector(
hasGestures: widget.isInteractive,
onDragWithOneFinger: (percentageOfChartWidth) {
if (DateTime.now().millisecondsSinceEpoch -
_timestampLastTwoFingersGesture <
50) {
return;
}
final highlightedDistance = _getXAtWidthPercentage(
percentageOfChartWidth,
);
_setCurrentHighlight(highlightedDistance);
_timestampLastTwoFingersGesture =
DateTime.now().millisecondsSinceEpoch;
},
onDragWithTwoFingers: (deltaXOffset) {
deltaXOffset =
deltaXOffset * _currentSectionLength * 0.0050;
final newMinX = _currentLeftX + deltaXOffset;
final newMaxX = _currentRightX + deltaXOffset;
if (newMinX < widget.minX) {
return;
}
if (newMaxX > widget.maxX) {
return;
}
_updatePresentedDomainLimits(newMinX, newMaxX);
_timestampLastTwoFingersGesture =
DateTime.now().millisecondsSinceEpoch;
},
onScale: (percentageOfChartWidth, horizontalScale) {
// Move towards scale's point of origin
final startScaleXOrigin = _getXAtWidthPercentage(
percentageOfChartWidth,
);
if (DateTime.now().millisecondsSinceEpoch -
_timestampLastScaleGesture >
200) {
_scaleOriginXMovingAverage = startScaleXOrigin;
} else {
const newPositionWeight = 0.01;
_scaleOriginXMovingAverage =
newPositionWeight * startScaleXOrigin +
(1 - newPositionWeight) *
_scaleOriginXMovingAverage;
}
_moveMiddleTowardsX(_scaleOriginXMovingAverage);
// Scale
horizontalScale = 1 / horizontalScale;
const lerpCoefficient = 0.01;
horizontalScale =
horizontalScale * lerpCoefficient +
(1 - lerpCoefficient);
final newLength =
_currentSectionLength * horizontalScale;
var newMinX = _currentMiddleX - newLength / 2;
var newMaxX = _currentMiddleX + newLength / 2;
if (newMinX < widget.minX) newMinX = widget.minX;
if (newMaxX > widget.maxX) newMaxX = widget.maxX;
double delta = newMaxX - newMinX;
if (delta < 10) return;
_updatePresentedDomainLimits(newMinX, newMaxX);
_timestampLastTwoFingersGesture =
DateTime.now().millisecondsSinceEpoch;
_timestampLastScaleGesture =
DateTime.now().millisecondsSinceEpoch;
},
child: AbsorbPointer(
child: LayoutBuilder(
builder: (context, widgetConstrains) {
return Stack(
clipBehavior: Clip.none,
fit: StackFit.expand,
children: [
_Chart(
minY: widget.minY,
maxY: widget.maxY,
minX: widget.minX,
maxX: widget.maxX,
spots: widget.spots,
highlightedIntervals:
widget.highlightedIntervals,
viewportController: viewportController,
),
_ChartTooptip(
xOffset: _getTooltipXOffset,
yOffset: _getTooltipYOffset,
indicatorColor:
widget.indicatorColor ??
Theme.of(context).colorScheme.secondary,
maxWidgetWidth: widgetConstrains.maxWidth,
maxWidgetHeight: widgetConstrains.maxHeight,
controller: tooltipController,
textColor: widget.indicatorColor == null
? Theme.of(
context,
).colorScheme.onSecondary
: Colors.black,
),
],
);
},
),
),
),
),
],
),
),
_BottomTitleBar(
originalMinX: _currentLeftX,
originalMaxX: _currentRightX,
intervalsCount: 4,
textColor: widget.legendLabelColor,
barHeight: ElevationChart.bottomLabelBarHeight,
leftOffset: ElevationChart.leftLabelBarWidth,
controller: titleBarController,
),
],
),
),
);
}
}
class _TooltipController {
void Function(FlSpot?) setHighlight = (_) {};
void Function() triggerRebuild = () {};
}
class _ChartTooptip extends StatefulWidget {
const _ChartTooptip({
required this.xOffset,
required this.yOffset,
required this.indicatorColor,
required this.maxWidgetWidth,
required this.maxWidgetHeight,
required this.controller,
required this.textColor,
});
final double Function(double) xOffset;
final double Function(double) yOffset;
final double maxWidgetWidth;
final double maxWidgetHeight;
final _TooltipController controller;
final Color indicatorColor;
final Color textColor;
@override
State<_ChartTooptip> createState() => _ChartTooptipState();
}
class _ChartTooptipState extends State<_ChartTooptip> {
FlSpot? highlight;
@override
void initState() {
super.initState();
_rebindControler();
}
@override
void didChangeDependencies() {
super.didChangeDependencies();
_rebindControler();
}
void _rebindControler() {
widget.controller.setHighlight = (spot) => setState(() {
highlight = spot;
});
widget.controller.triggerRebuild = () => setState(() {});
}
@override
Widget build(BuildContext context) {
if (highlight == null) return Container();
final offsetX = widget.xOffset(widget.maxWidgetWidth);
final offsetY = widget.yOffset(widget.maxWidgetHeight);
if (offsetX < -ElevationChart.tooptipWidth / 2 ||
offsetX > widget.maxWidgetWidth - ElevationChart.tooptipWidth / 2) {
return Container();
}
return Positioned(
left: offsetX,
bottom: offsetY,
child: SizedBox(
width: ElevationChart.tooptipWidth,
child: Column(
mainAxisSize: MainAxisSize.min,
children: [
Container(
height: 25,
padding: const EdgeInsets.symmetric(horizontal: 5),
decoration: BoxDecoration(color: widget.indicatorColor),
child: Center(
child: FittedBox(
fit: BoxFit.contain,
child: Text(
convertDistance(highlight!.y),
style: TextStyle(fontSize: 16, color: widget.textColor),
),
),
),
),
Text(
"▼",
style: TextStyle(color: widget.indicatorColor, height: 0.6),
),
],
),
),
);
}
}
class _ViewportController {
void Function(double, double) changeViewport = (a, b) {};
}
class _Chart extends StatefulWidget {
const _Chart({
required this.minY,
required this.maxY,
required this.minX,
required this.maxX,
required this.spots,
required this.highlightedIntervals,
required this.viewportController,
});
final double minY;
final double maxY;
final double minX;
final double maxX;
final List<FlSpot> spots;
final List<(List<FlSpot>, Color)> highlightedIntervals;
final _ViewportController viewportController;
@override
State<_Chart> createState() => _ChartState();
}
class _ChartState extends State<_Chart> {
late double currentLeftX;
late double currentRightX;
@override
void initState() {
super.initState();
currentLeftX = widget.minX;
currentRightX = widget.maxX;
_rebindController();
}
@override
void didChangeDependencies() {
super.didChangeDependencies();
_rebindController();
}
void _rebindController() {
widget.viewportController.changeViewport = (left, right) {
setState(() {
currentLeftX = left;
currentRightX = right;
});
};
}
@override
Widget build(BuildContext context) {
return LineChart(
LineChartData(
titlesData: const FlTitlesData(
bottomTitles: AxisTitles(sideTitles: SideTitles(showTitles: false)),
topTitles: AxisTitles(sideTitles: SideTitles(showTitles: false)),
leftTitles: AxisTitles(sideTitles: SideTitles(showTitles: false)),
rightTitles: AxisTitles(sideTitles: SideTitles(showTitles: false)),
),
maxY: widget.maxY,
minY: widget.minY,
maxX: currentRightX,
minX: currentLeftX,
// Data
lineBarsData: [
LineChartBarData(
spots: widget.spots,
isCurved: false,
barWidth: 4,
color: const Color(0xFF3a77ff),
dotData: const FlDotData(show: false),
belowBarData: BarAreaData(
show: true,
color: const Color.fromARGB(200, 157, 200, 250),
),
),
for (final interval in widget.highlightedIntervals)
LineChartBarData(
spots: interval.dart,
isCurved: true,
barWidth: 5,
color: interval.,
dotData: const FlDotData(show: false),
belowBarData: BarAreaData(
show: true,
color: const Color(0xFF1F8AFE),
),
),
],
// Background grid
gridData: const FlGridData(
show: false,
drawVerticalLine: false,
horizontalInterval: 1000,
verticalInterval: 100,
),
//Border
borderData: FlBorderData(
show: true,
border: const Border(
top: BorderSide(width: 0, color: Colors.transparent),
right: BorderSide(width: 0, color: Colors.transparent),
bottom: BorderSide(width: 1, color: Color(0xff37434d)),
left: BorderSide(width: 1, color: Color(0xff37434d)),
),
),
clipData: const FlClipData.all(),
),
);
}
}
class _TitleBarController {
void Function(double start, double end) verticalAxisViewportChanged =
(_, _) {};
void Function(double start, double end) horizontalAxisViewportChanged =
(_, _) {};
}
class _LeftTitleBar extends StatefulWidget {
final double originalMinY;
final double originalMaxY;
final int intervalsCount;
final double barWidth;
final double bottomOffset;
final _TitleBarController controller;
final Color textColor;
const _LeftTitleBar({
required this.originalMinY,
required this.originalMaxY,
required this.intervalsCount,
required this.barWidth,
required this.bottomOffset,
required this.textColor,
required this.controller,
});
@override
State<_LeftTitleBar> createState() => _LeftTitleBarState();
}
class _LeftTitleBarState extends State<_LeftTitleBar> {
double minY = 0;
double maxY = 0;
@override
void initState() {
super.initState();
minY = widget.originalMinY;
maxY = widget.originalMaxY;
_bindController();
}
@override
void didChangeDependencies() {
super.didChangeDependencies();
_bindController();
}
void _bindController() {
widget.controller.verticalAxisViewportChanged = (mn, mx) {
setState(() {
minY = mn;
maxY = mx;
});
};
}
double getValueAtInterval(int interval) {
return minY +
(maxY - minY) *
(widget.intervalsCount - interval - 1) /
(widget.intervalsCount - 1);
}
@override
Widget build(BuildContext context) {
return SizedBox(
width: widget.barWidth,
child: Column(
children: [
Expanded(
child: Column(
mainAxisAlignment: MainAxisAlignment.spaceBetween,
children: [
for (int i = 0; i < widget.intervalsCount; i++)
Text(
convertDistance(getValueAtInterval(i)),
style: TextStyle(fontSize: 9, color: widget.textColor),
textAlign: TextAlign.right,
),
],
),
),
SizedBox(height: widget.bottomOffset),
],
),
);
}
}
class _BottomTitleBar extends StatefulWidget {
final double originalMinX;
final double originalMaxX;
final int intervalsCount;
final double barHeight;
final double leftOffset;
final _TitleBarController controller;
final Color textColor;
const _BottomTitleBar({
required this.originalMinX,
required this.originalMaxX,
required this.intervalsCount,
required this.barHeight,
required this.leftOffset,
required this.textColor,
required this.controller,
});
@override
State<_BottomTitleBar> createState() => _BottomTitleBarState();
}
class _BottomTitleBarState extends State<_BottomTitleBar> {
double minX = 0;
double maxX = 0;
@override
void initState() {
super.initState();
minX = widget.originalMinX;
maxX = widget.originalMaxX;
_bindController();
}
@override
void didChangeDependencies() {
super.didChangeDependencies();
_bindController();
}
void _bindController() {
widget.controller.horizontalAxisViewportChanged = (mn, mx) {
setState(() {
minX = mn;
maxX = mx;
});
};
}
double getValueAtInterval(int interval) {
return minX + (maxX - minX) * interval / (widget.intervalsCount - 1);
}
@override
Widget build(BuildContext context) {
return SizedBox(
height: widget.barHeight,
child: Row(
children: [
SizedBox(width: widget.leftOffset),
Expanded(
child: Row(
mainAxisAlignment: MainAxisAlignment.spaceBetween,
children: [
for (int i = 0; i < widget.intervalsCount; i++)
Text(
convertDistance(getValueAtInterval(i)),
style: TextStyle(fontSize: 9, color: widget.textColor),
),
],
),
),
],
),
);
}
}
class _ChartGestureDetector extends StatelessWidget {
final void Function(double percentageOfChartWidth) onDragWithOneFinger;
final void Function(double deltaXOffset) onDragWithTwoFingers;
final void Function(
double percentageOfChartWidthStart,
double horizontalScale,
)
onScale;
final Widget child;
final bool hasGestures;
const _ChartGestureDetector({
required this.onDragWithOneFinger,
required this.onDragWithTwoFingers,
required this.onScale,
required this.hasGestures,
required this.child,
});
double getPercentageOfChartWidthFromXOffset(
double xOffset,
double widgetWidth,
) {
return xOffset / widgetWidth;
}
@override
Widget build(BuildContext context) {
return LayoutBuilder(
builder: (context, constrains) {
return GestureDetector(
onScaleUpdate: (details) {
if (!hasGestures) {
return;
}
// Higher than 1 -> gestures with high vertical range are more likely to be recognized
// Closer to 1 -> gestures with high vertical range are less likely to be recognized
const scaleV = 5;
// Higher than 1 -> the gesture has higher chance of being registered as DRAG TWO FINGERS
// Closer to 1 -> the gesture has higher chance of being registered as SCALE
const scaleH = 1.30;
// Ignore extreme vertical gestures
if (details.verticalScale < 1 / scaleV ||
details.verticalScale > scaleV) {
return;
}
if (details.scale < 1 / scaleH || details.scale > scaleH) {
// SCALE
final horizontalScale = details.horizontalScale;
final startLocalFocalPointX = details.localFocalPoint.dx;
final startPercentageX = getPercentageOfChartWidthFromXOffset(
startLocalFocalPointX,
constrains.maxWidth,
);
onScale(startPercentageX, horizontalScale);
} else if (details.pointerCount == 1) {
// DRAG ONE FINGER
final percentageOfWidgetX = getPercentageOfChartWidthFromXOffset(
details.localFocalPoint.dx,
constrains.maxWidth,
);
if (percentageOfWidgetX < 0 || percentageOfWidgetX > 1) return;
onDragWithOneFinger(percentageOfWidgetX);
} else if (details.pointerCount == 2) {
// DRAG TWO FINGERS
onDragWithTwoFingers(-details.focalPointDelta.dx);
}
},
child: child,
);
},
);
The state class (_LineAreaChartState) wires up gesture detection, viewport changes, and tooltips, while private widgets like _Chart, _LeftTitleBar, and _BottomTitleBar handle chart drawing and axis labels.
What the User Sees
When embedded in the app, the chart shows:
- A blue elevation profile shaded under the curve.
- Climb segments overlaid in red/orange (based on grade).
- Y-axis labels → elevation values (meters).
- X-axis labels → distance (meters/kilometers).
- A tooltip box that appears when dragging, showing the elevation at the highlighted point.
The chart transforms a static route into an explorable profile.
Users can zoom in to inspect a steep climb, drag to preview specific sections, or just glance at colors to see where the toughest parts are.
Utility Functions
// Utility function to convert the meters distance into a suitable format.
String convertDistance(double meters) {
  if (meters >= 1000) {
    double kilometers = meters / 1000;
    return '${kilometers.toStringAsFixed(1)} km';
  } else {
    return '${meters.toStringAsFixed(1)} m';
  }
}

// Get the color of the section based on its type
Color getColorBasedOnType(Enum type) {
  if (type is SurfaceType) return _getSurfaceTypeColor(type);
  if (type is RoadType) return _getRoadTypeColor(type);
  if (type is Steepness) return _getSteepnessColor(type);
  return const Color.fromARGB(255, 10, 10, 10);
}

// Get the color of the section based on surface type
Color _getSurfaceTypeColor(SurfaceType type) {
  switch (type) {
    case SurfaceType.asphalt:
      return const Color.fromARGB(255, 127, 137, 149);
    case SurfaceType.paved:
      return const Color.fromARGB(255, 212, 212, 212);
    case SurfaceType.unknown:
      return const Color.fromARGB(255, 10, 10, 10);
    case SurfaceType.unpaved:
      return const Color.fromARGB(255, 157, 133, 104);
  }
}

// Get the color of the section based on road type
Color _getRoadTypeColor(RoadType type) {
  switch (type) {
    case RoadType.motorways:
      return const Color.fromARGB(255, 242, 144, 99);
    case RoadType.stateRoad:
      return const Color.fromARGB(255, 242, 216, 99);
    case RoadType.cycleway:
      return const Color.fromARGB(255, 15, 175, 135);
    case RoadType.road:
      return const Color.fromARGB(255, 153, 163, 175);
    case RoadType.path:
      return const Color.fromARGB(255, 196, 200, 211);
    case RoadType.singleTrack:
      return const Color.fromARGB(255, 166, 133, 96);
    case RoadType.street:
      return const Color.fromARGB(255, 175, 185, 193);
  }
}

// Get the color of the section based on steepness
Color _getSteepnessColor(Steepness steepness) {
  switch (steepness) {
    case Steepness.descendExtreme:
      return const Color.fromARGB(255, 4, 120, 8);
    case Steepness.descendVeryHigh:
      return const Color.fromARGB(255, 38, 151, 41);
    case Steepness.descendHigh:
      return const Color.fromARGB(255, 73, 183, 76);
    case Steepness.descendLow:
      return const Color.fromARGB(255, 112, 216, 115);
    case Steepness.descendVeryLow:
      return const Color.fromARGB(255, 154, 250, 156);
    case Steepness.neutral:
      return const Color.fromARGB(255, 255, 197, 142);
    case Steepness.ascendVeryLow:
      return const Color.fromARGB(255, 240, 141, 141);
    case Steepness.ascendLow:
      return const Color.fromARGB(255, 220, 105, 105);
    case Steepness.ascendHigh:
      return const Color.fromARGB(255, 201, 73, 73);
    case Steepness.ascendVeryHigh:
      return const Color.fromARGB(255, 182, 42, 42);
    case Steepness.ascendExtreme:
      return const Color.fromARGB(255, 164, 16, 16);
  }
}

// Get the color of the section based on grade
Color getGradeColor(ClimbSection section) {
  switch (section.grade) {
    case Grade.gradeHC:
      return const Color.fromARGB(100, 255, 100, 40);
    case Grade.grade1:
      return const Color.fromARGB(100, 255, 140, 40);
    case Grade.grade2:
      return const Color.fromARGB(100, 255, 180, 40);
    case Grade.grade3:
      return const Color.fromARGB(100, 255, 220, 40);
    case Grade.grade4:
      return const Color.fromARGB(100, 255, 240, 40);
  }
}

int totalDistance(Route route) {
  return route.getTimeDistance().totalDistanceM;
}