|
In this guide, you will learn how to add a dataset based on a GeoJSON file and link the dataset to a style. The style is then applied to a map.
The dataset is available as an overlay, with the individual points presented as OverlayItem.
How it works
- Import the dataset and create the style in Magic Lane Console.
- Apply the style containing the dataset to a map.
- Interact with the map to see the overlay items.
Import the Dataset
We will need a GeoJSON file containing custom POI information. You can use the GP Surgeries in York or any other GeoJSON containing points data.
Download the GeoJSON file.
For this example, a Magic Lane account is mandatory. Login into your Magic Lane account or register a new account.
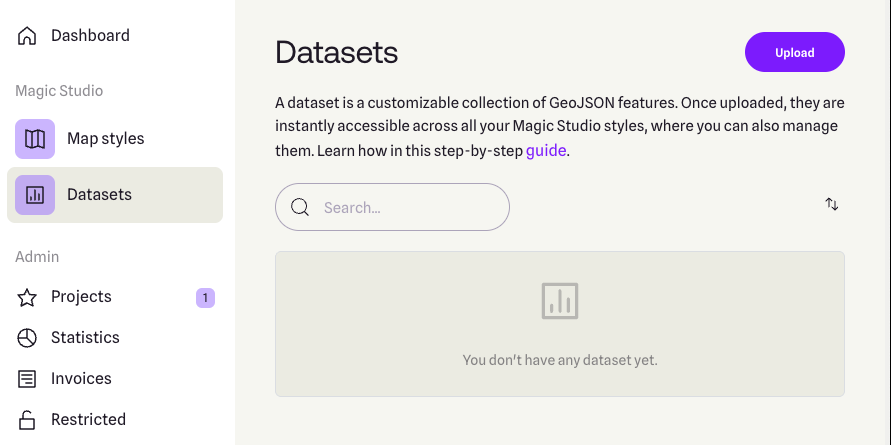
Enter the Datasets tab from the Magic Lane Console and click the Upload button from the top right corner.
Drag and drop the downloaded GeoJSON file into the upload area or select the file manually. Click the Upload button to finish. The dataset should now be visible in the list.
At the moment, there are no option to automatically update the dataset.
Create a Map Style
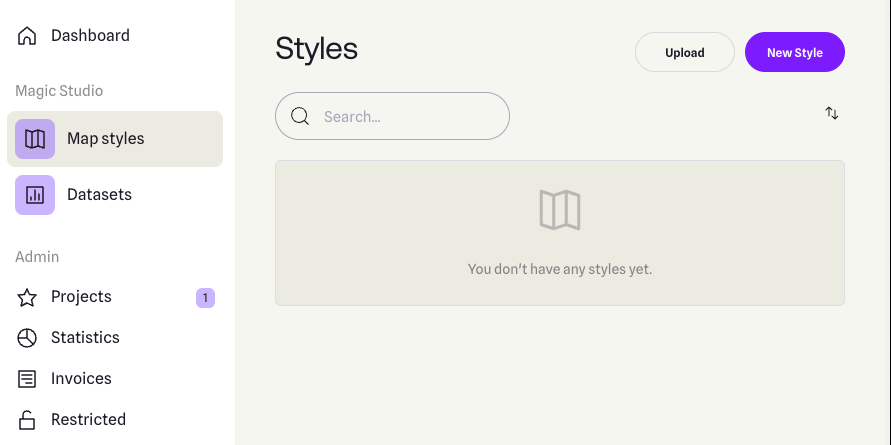
Enter the Styles tab from the Magic Lane Console and click the New Style button from the top right corner.
Alternatively, you can use an existing style as a base by clicking the Upload button and selecting a style file.
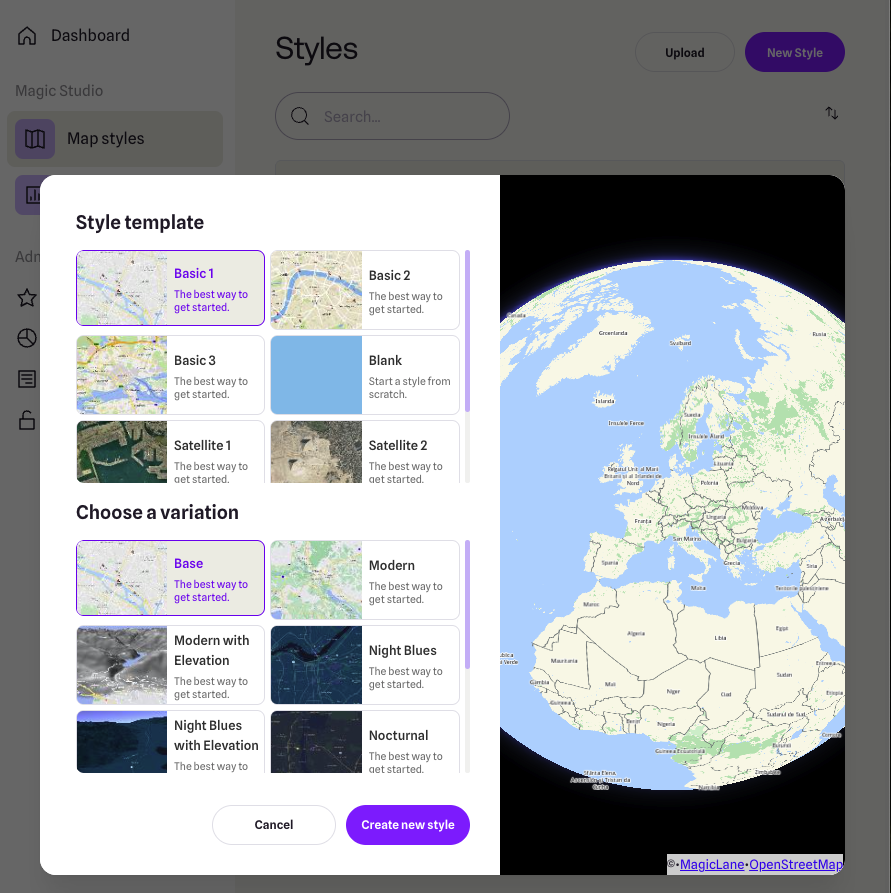
Select a template and a variation. Select Create New Style from the bottom side.
Style template and variation
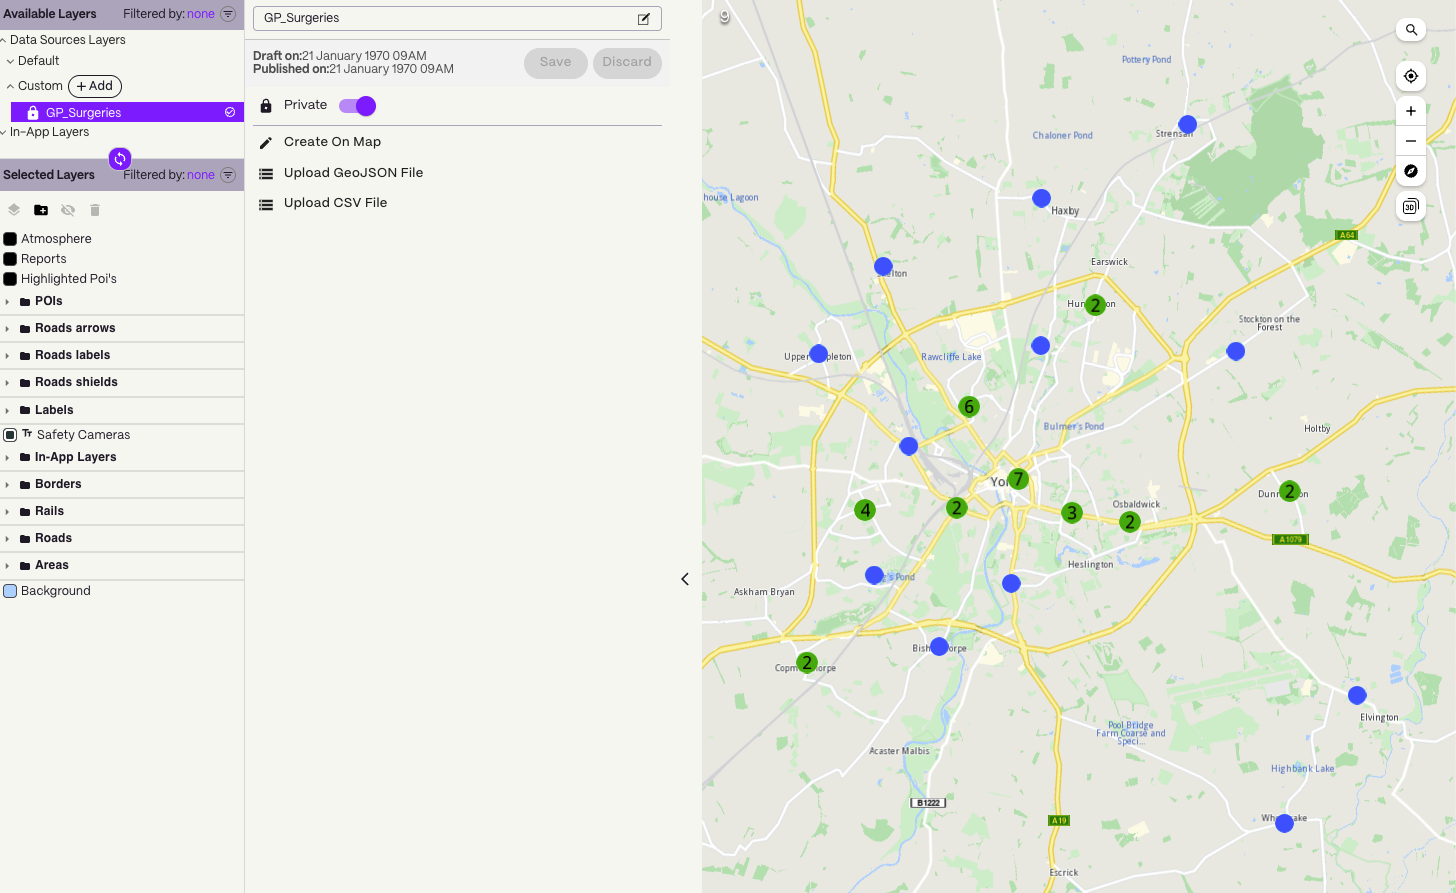
Under the Available Layers section, expand the Custom group and select the dataset you just uploaded. The dataset should now be visible on the map in the relevant geographic region (the city of York, UK).
Dataset is under Available Layers
If the privacy switch is set to Private, the dataset will only be available in apps activated with a token created by you which have the associated style applied.
If the privacy switch is set to Public, the dataset will be available in all apps activated where the associated style is applied, regardless of the token used.
Drag and drop the dataset from the Available Layers section to the Selected Layers section.
The dataset is now linked to the style. The points should be visible on the map as pinpoints icons.
Dataset is under Selected Layers
The dataset needs to be dragged under the Selected Layers section to be visible on the map on the exported style.
Style the overlay items
Render Type
The Render Type tab controlls if the data should be rendered as symbols, groups of symbols, lines of shapes, depending on the geometry.
Zoom Range
The Zoom Range specifies the minimum and maximum zoom levels at which the layer is visible. A higher value means the camera is closer to the ground.
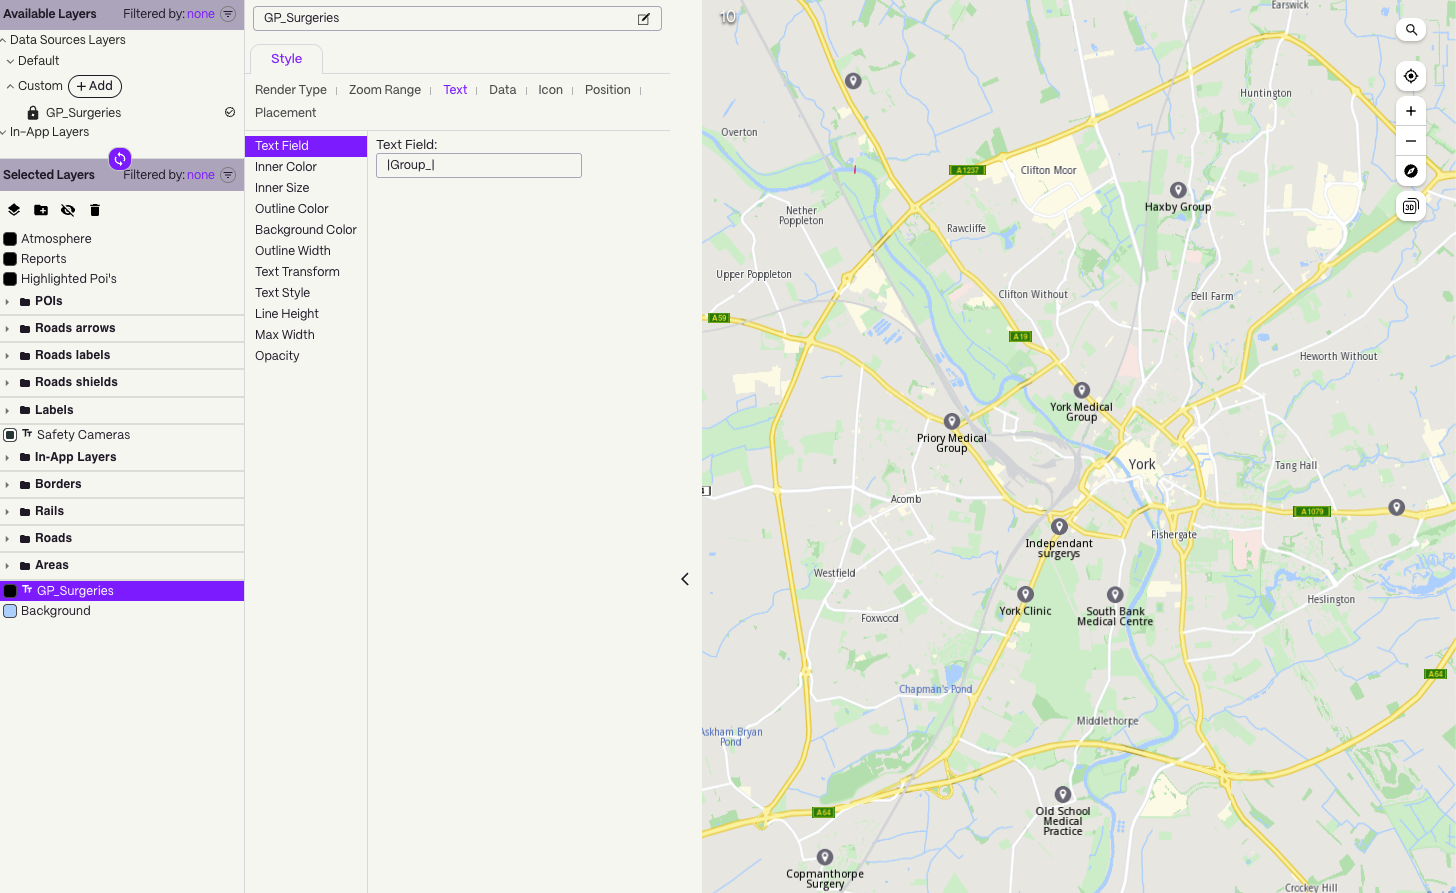
Text
The Text tab allows you to specify the text for each point and customize its appearance.
A propery from the GeoJSON can be used as the text. For example, if the GeoJSON feature has a property called name, you can use it as the text by entering |name| in the Text Field.
As the provided GeoJSON file has the following feature structure, we will use |Group_| as the value for the Text Field to display the name of the GP surgery:
{
  "type": "Feature",
  "properties": {
    "OBJECTID": 1,
    "Group_": "Old School Medical Practice",
    "Address_1": "Old School Medical Practice",
    "Address_2": "Horseman Lane",
    "Town": "York",
    "Postcode": "YO23 3UA",
    "opening_ho": "8am - 6pm",
    "Saturday": "Closed",
    "Sunday": "Closed",
    "Ward": "00FFxx1"
  },
  "geometry": {
    "type": "Point",
    "coordinates": [
      -1.142303573355,
      53.91565528443143,
      0
    ]
  }
}
The result can be seen in the image above.
Icon
The Icon tab allows you to select the icon for the points. You can use one of the available icons.
There are also options to change the size of the icon.
On the right side of top status bar there is a Images button that allows you to upload custom icons to be used within the style, including for the OverlayItem icon.
Position
The Position tab allows you to specify the position of the text relative to the icon, the rotation angle and offsets.
Placement
The Placement tab controlls options such as overlap, padding and other settings.
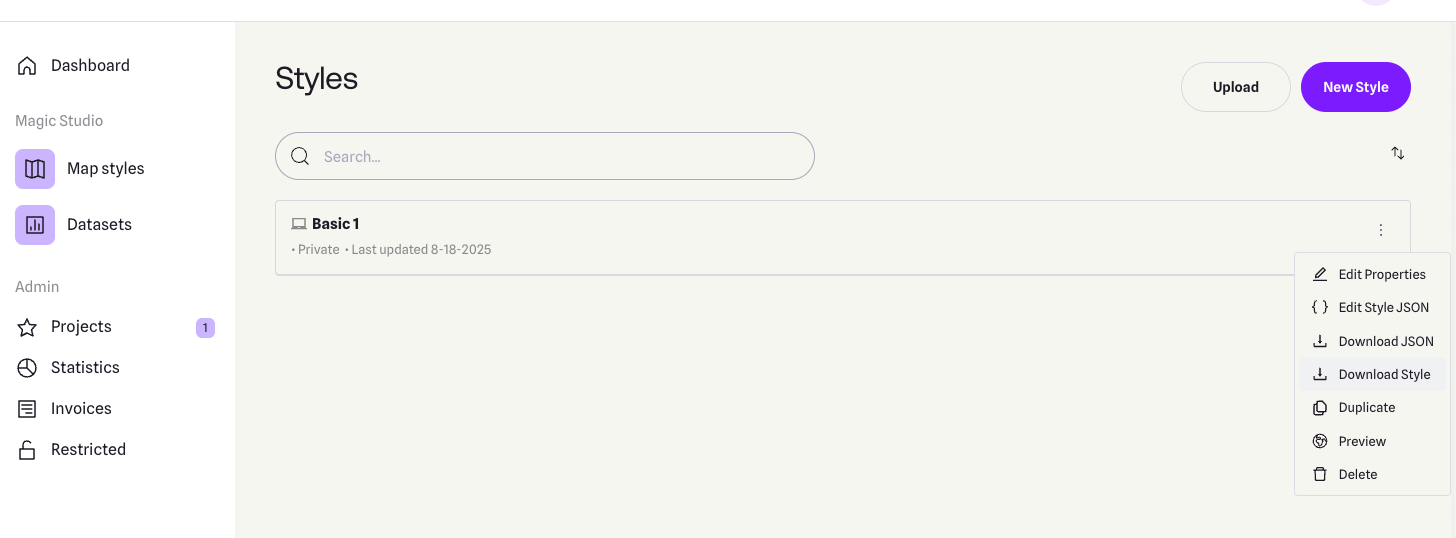
Download the style
Go back to the Styles page. On the right side of the style you just created, click the menu button and select Download Style.
Rename the file to style_with_data.style and save it to the assets folder of the example.
Set token and overlay uid
The projectApiToken you provide to the GemMap widget must be created by the same account that owns both the dataset and the style. If the token is generated from a different account, the dataset will remain inaccessible (since it is private).
Be sure to update the constants projectApiToken and overlayUid in the main.dart file of the example with the correct values.
You can find the overlayUid of your custom dataset by following these steps:
- Open the Styles page.
- Locate the relevant style and click the menu button from the right side.
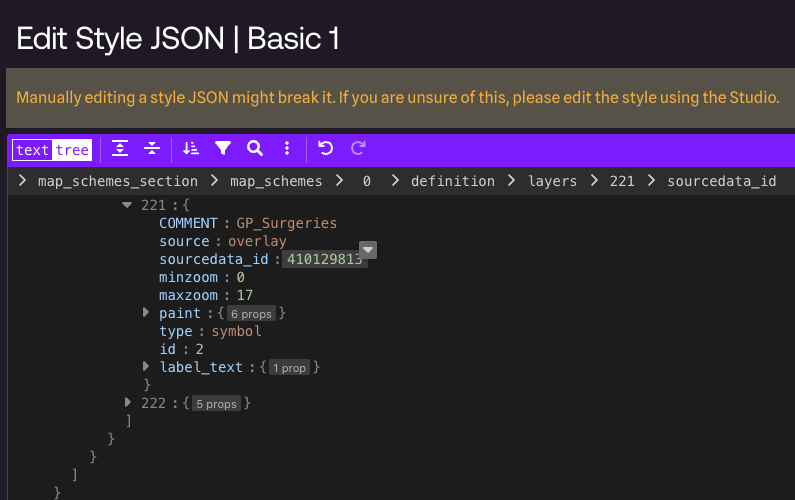
- Choose Edit style JSON.
- In the JSON file, navigate to:
map_scheme_section > map_schemes > 0 > definitions > layer > [layer number depending on the layer order] > sourcedata_id
- The value of
sourcedata_id is your overlayUid.
Do not modify the JSON file, as it may cause issues.
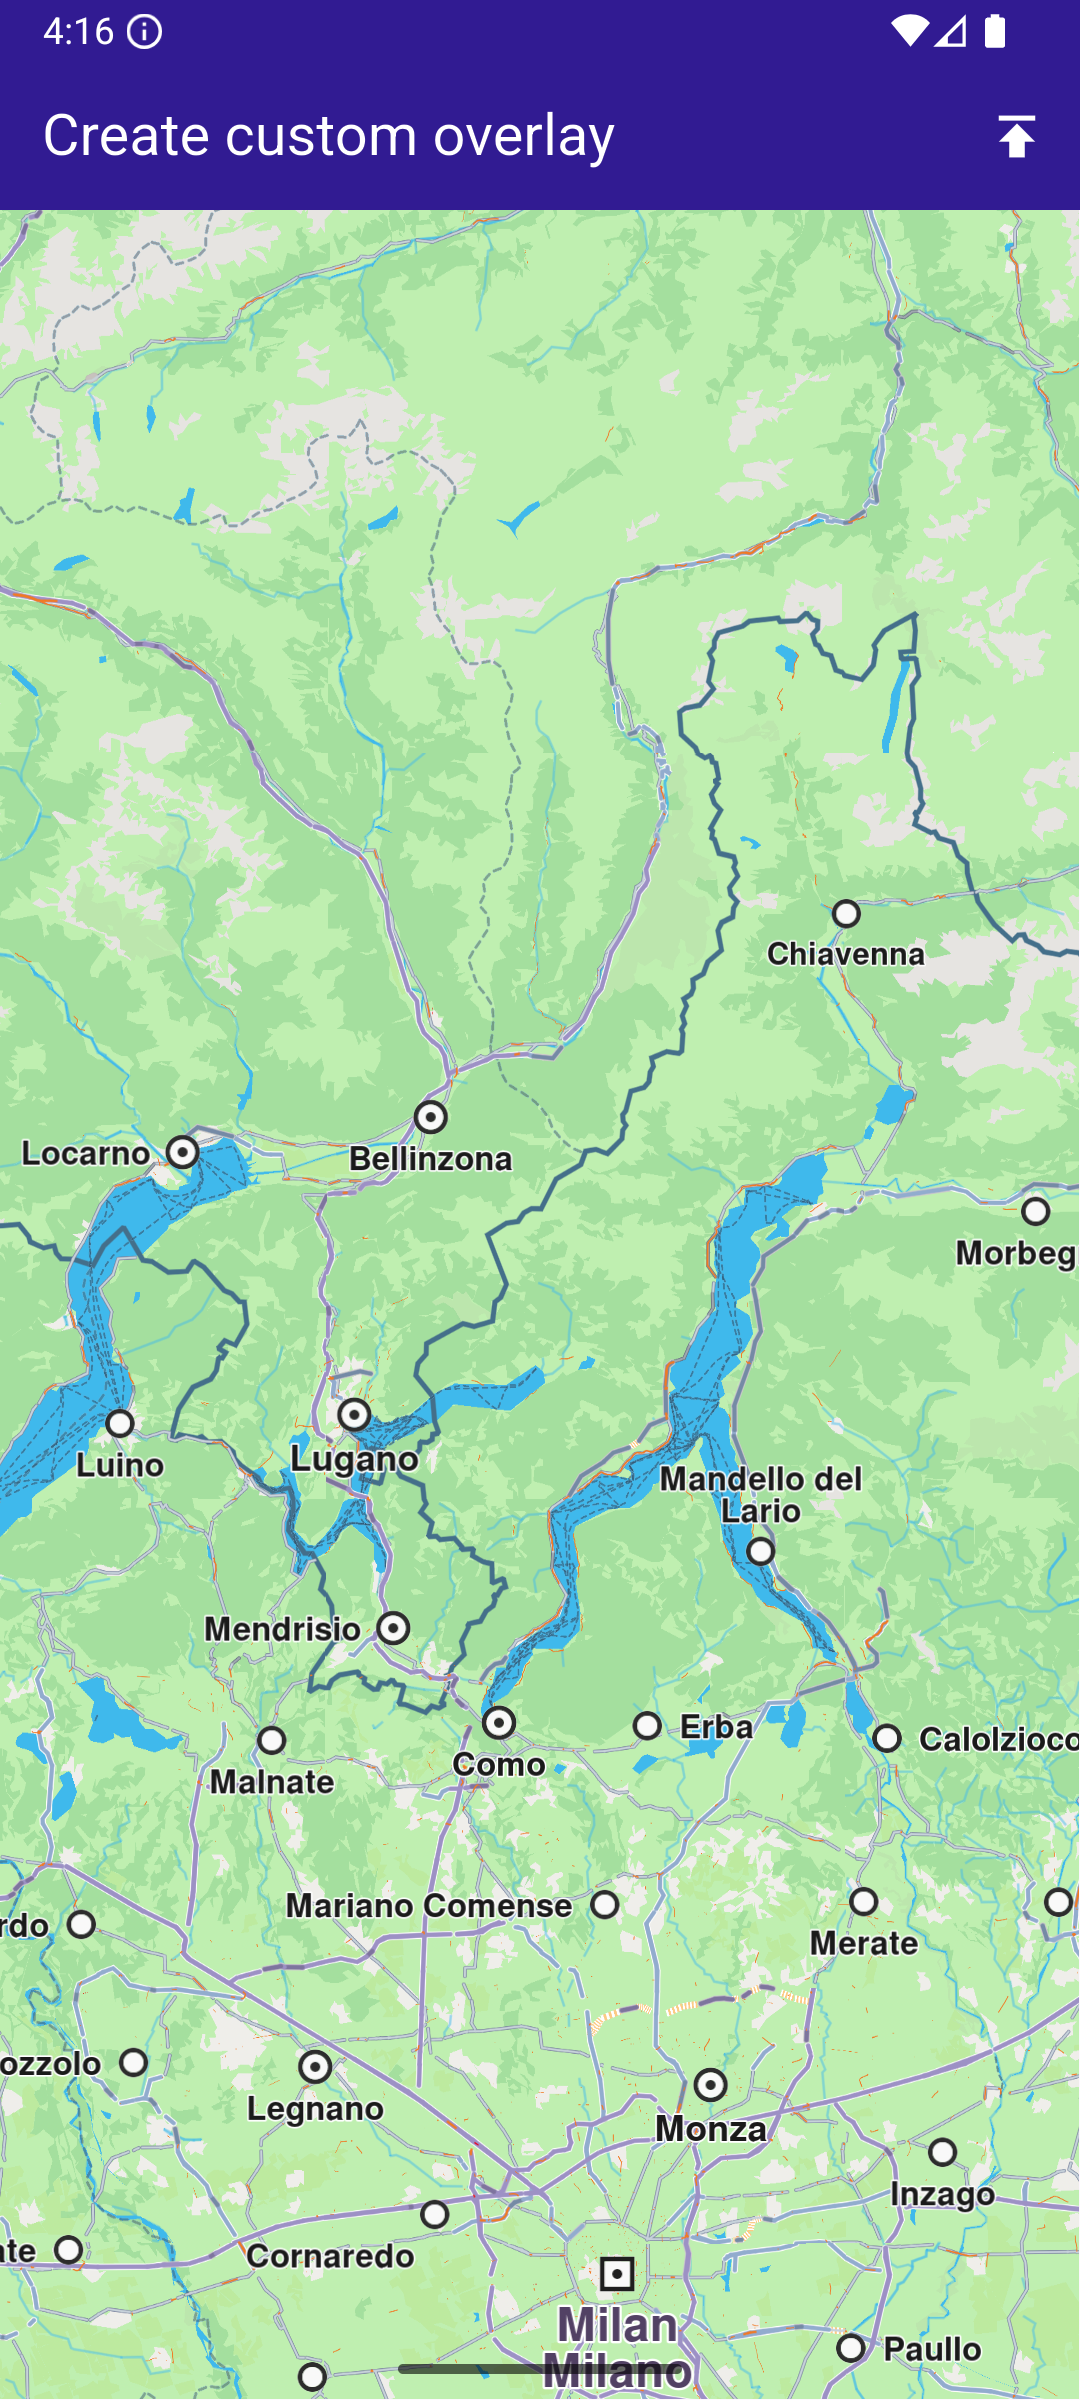
UI and Map Integration
The main app shows a map, applies the custom style and enables searching only in the overlay.
By updating the SearchPreferences to include only the overlay, all subsequent searches will be scoped to these objects, improving search accuracy.
import 'dart:async';
import 'dart:io';
import 'package:flutter/services.dart';
import 'package:magiclane_maps_flutter/core.dart';
import 'package:magiclane_maps_flutter/map.dart';
import 'package:flutter/material.dart' hide Route;
import 'package:magiclane_maps_flutter/search.dart';
import 'package:create_custom_overlay/overlay_item_panel.dart';
import 'package:create_custom_overlay/search_page.dart';
const projectApiToken = String.fromEnvironment('YOUR_API_TOKEN_HERE');
const overlayUid = 0;
void main() {
print(pid);
runApp(const MyApp());
}
class MyApp extends StatelessWidget {
const MyApp({super.key});
@override
Widget build(BuildContext context) {
return const MaterialApp(debugShowCheckedModeBanner: false, title: 'Create custom overlay', home: MyHomePage());
}
}
class MyHomePage extends StatefulWidget {
const MyHomePage({super.key});
@override
State<MyHomePage> createState() => _MyHomePageState();
}
class _MyHomePageState extends State<MyHomePage> {
late GemMapController _mapController;
OverlayItem? _focusedOverlayItem;
late SearchPreferences preferences;
bool isMapApplied = false;
@override
void dispose() {
GemKit.release();
super.dispose();
}
@override
Widget build(BuildContext context) {
return Scaffold(
appBar: AppBar(
backgroundColor: Colors.deepPurple[900],
title: const Text("Create custom overlay", style: TextStyle(color: Colors.white)),
actions: [
IconButton(
onPressed: applyStyle,
icon: const Icon(Icons.publish, color: Colors.white),
),
if (isMapApplied)
IconButton(
onPressed: () => _onSearchButtonPressed(context, preferences),
icon: const Icon(Icons.search, color: Colors.white),
),
],
),
body: Stack(
children: [
GemMap(key: ValueKey("GemMap"), onMapCreated: _onMapCreated, appAuthorization: projectApiToken),
if (_focusedOverlayItem != null)
Positioned(
bottom: 30,
child: OverlayItemPanel(onCancelTap: _onCancelOverlayItemPanelTap, overlayItem: _focusedOverlayItem!),
),
],
),
resizeToAvoidBottomInset: false,
);
}
void _onMapCreated(GemMapController controller) {
_mapController = controller;
_registerLandmarkTapCallback();
}
void applyStyle() async {
final assetStyleData = await rootBundle.load('assets/style_with_data.style');
final assetStyleBytes = assetStyleData.buffer.asUint8List();
_mapController.preferences.setMapStyleByBuffer(assetStyleBytes);
RectangleGeographicArea yorkArea = RectangleGeographicArea(
topLeft: Coordinates(latitude: 54.0001, longitude: -1.1678),
bottomRight: Coordinates(latitude: 53.9130, longitude: -1.0015),
);
_mapController.centerOnArea(yorkArea);
preferences = SearchPreferences();
await _awaitOverlaysReady();
preferences.overlays.add(overlayUid);
preferences.searchMapPOIs = false;
preferences.searchAddresses = false;
setState(() {
isMapApplied = true;
});
}
Future<void> _awaitOverlaysReady() async {
Completer<void> completer = Completer<void>();
OverlayService.getAvailableOverlays(
onCompleteDownload: (GemError error) {
if (error != GemError.success) {
print("Error while getting overlays: $error");
}
completer.complete();
},
);
await completer.future;
}
Future<void> _registerLandmarkTapCallback() async {
_mapController.registerOnTouch((pos) async {
await _mapController.setCursorScreenPosition(pos);
final overlayItems = _mapController.cursorSelectionOverlayItems();
await _mapController.resetMapSelection();
if (overlayItems.isNotEmpty) {
_highlightOverlayItems(overlayItems);
return;
}
});
}
void _highlightOverlayItems(List<OverlayItem> overlayItems) {
final settings = HighlightRenderSettings(
options: {HighlightOptions.showLandmark, HighlightOptions.showContour, HighlightOptions.overlap},
);
_mapController.activateHighlightOverlayItems(overlayItems, renderSettings: settings);
final overlay = overlayItems[0];
setState(() {
_focusedOverlayItem = overlay;
});
Future.delayed(Duration(milliseconds: 500), () {
_mapController.centerOnCoordinates(overlay.coordinates);
});
}
void _onCancelOverlayItemPanelTap() {
_mapController.deactivateAllHighlights();
setState(() {
_focusedOverlayItem = null;
});
}
void _onSearchButtonPressed(BuildContext context, SearchPreferences preferences) async {
final result = await Navigator.of(context).push(
MaterialPageRoute<dynamic>(
builder: (context) =>
SearchPage(coordinates: Coordinates.fromLatLong(53.9617, -1.0779), preferences: preferences),
),
);
if (result is OverlayItem) {
_mapController.centerOnCoordinates(result.coordinates, zoomLevel: 70);
}
}
}
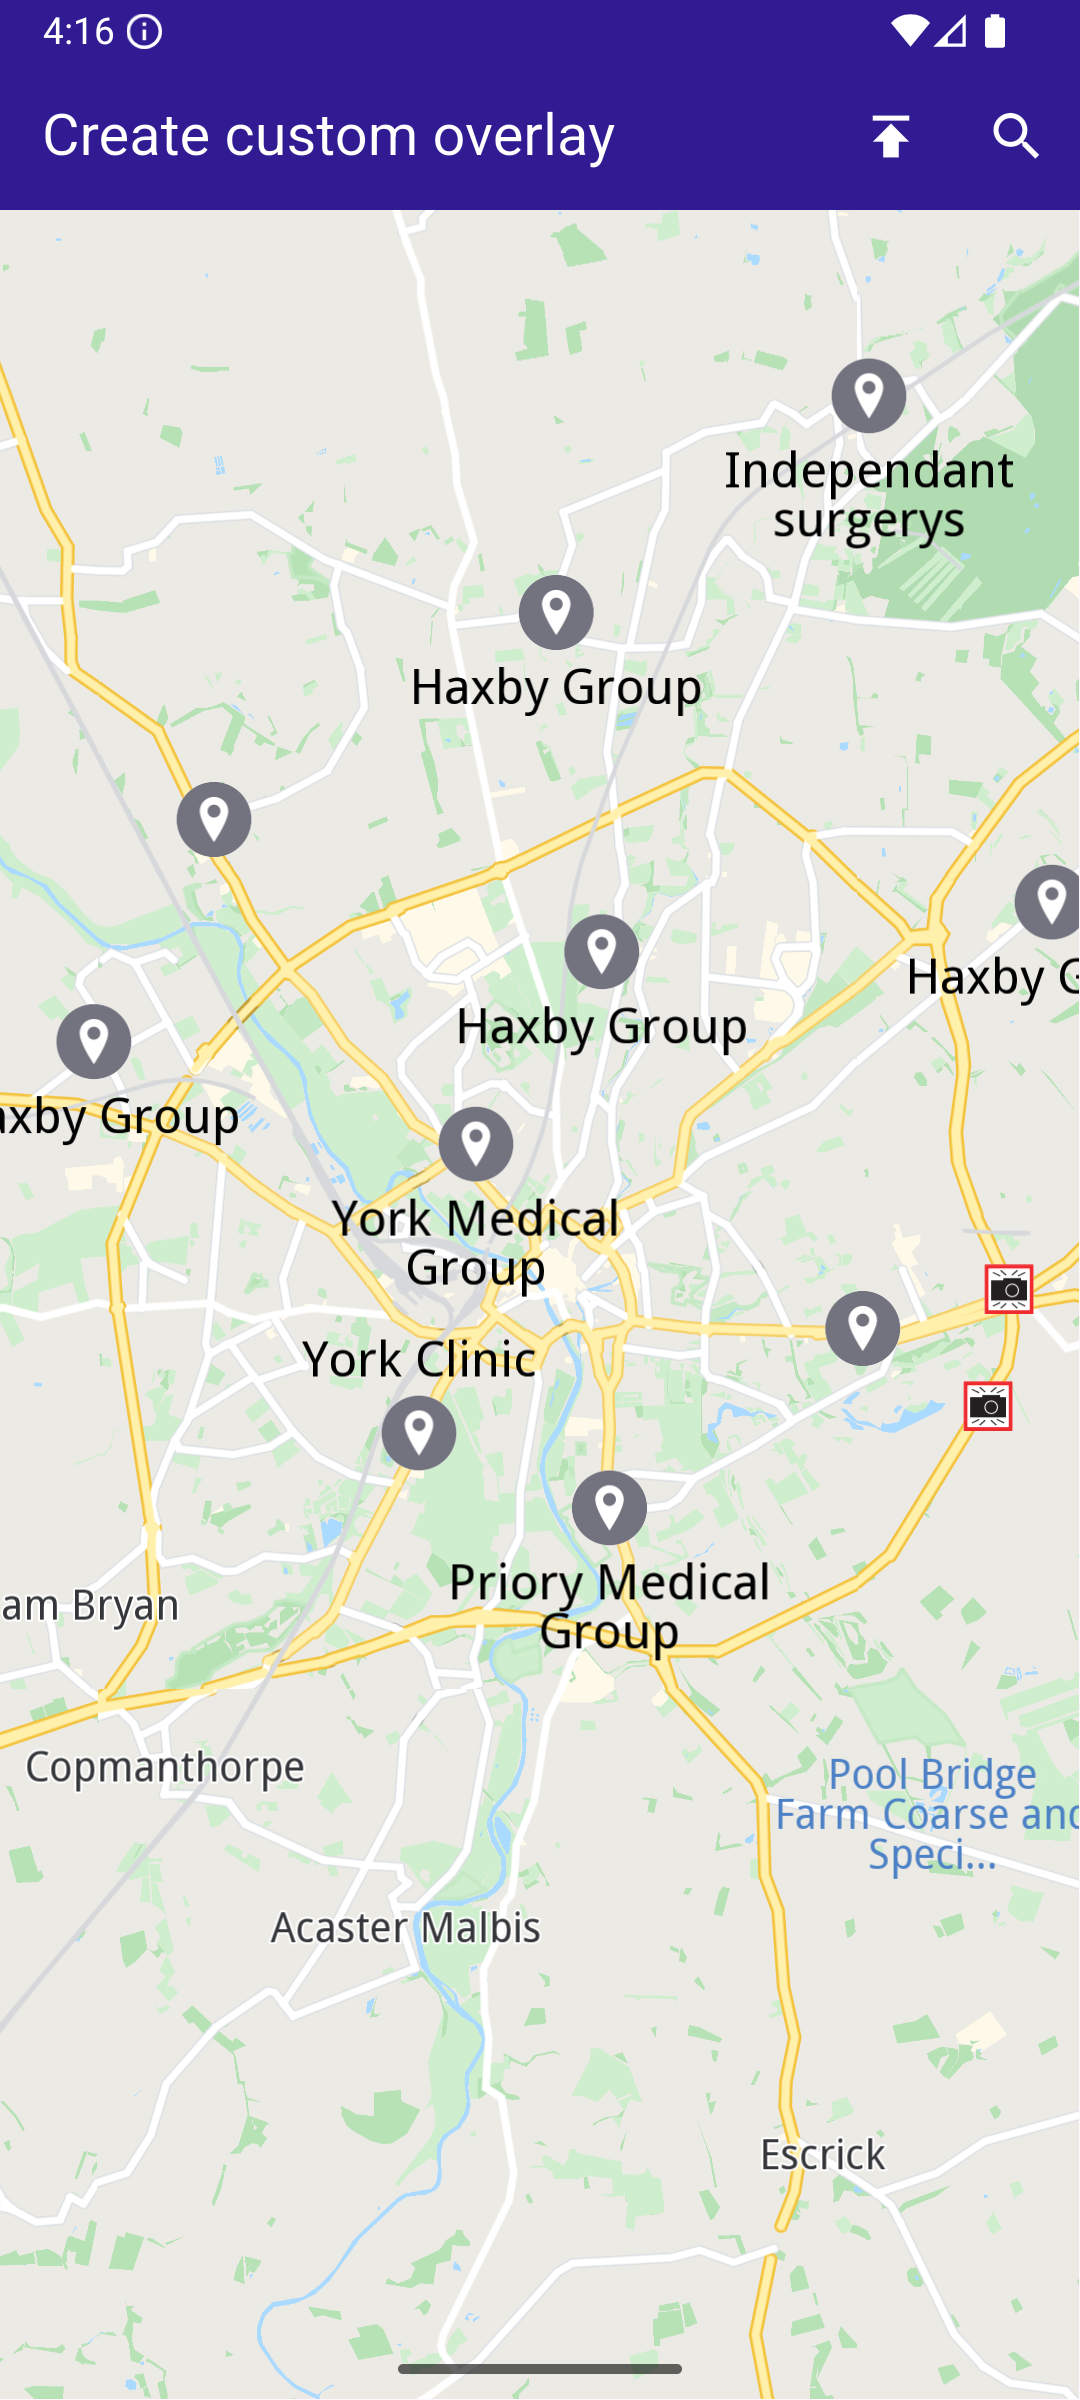
Map with style containing dataset
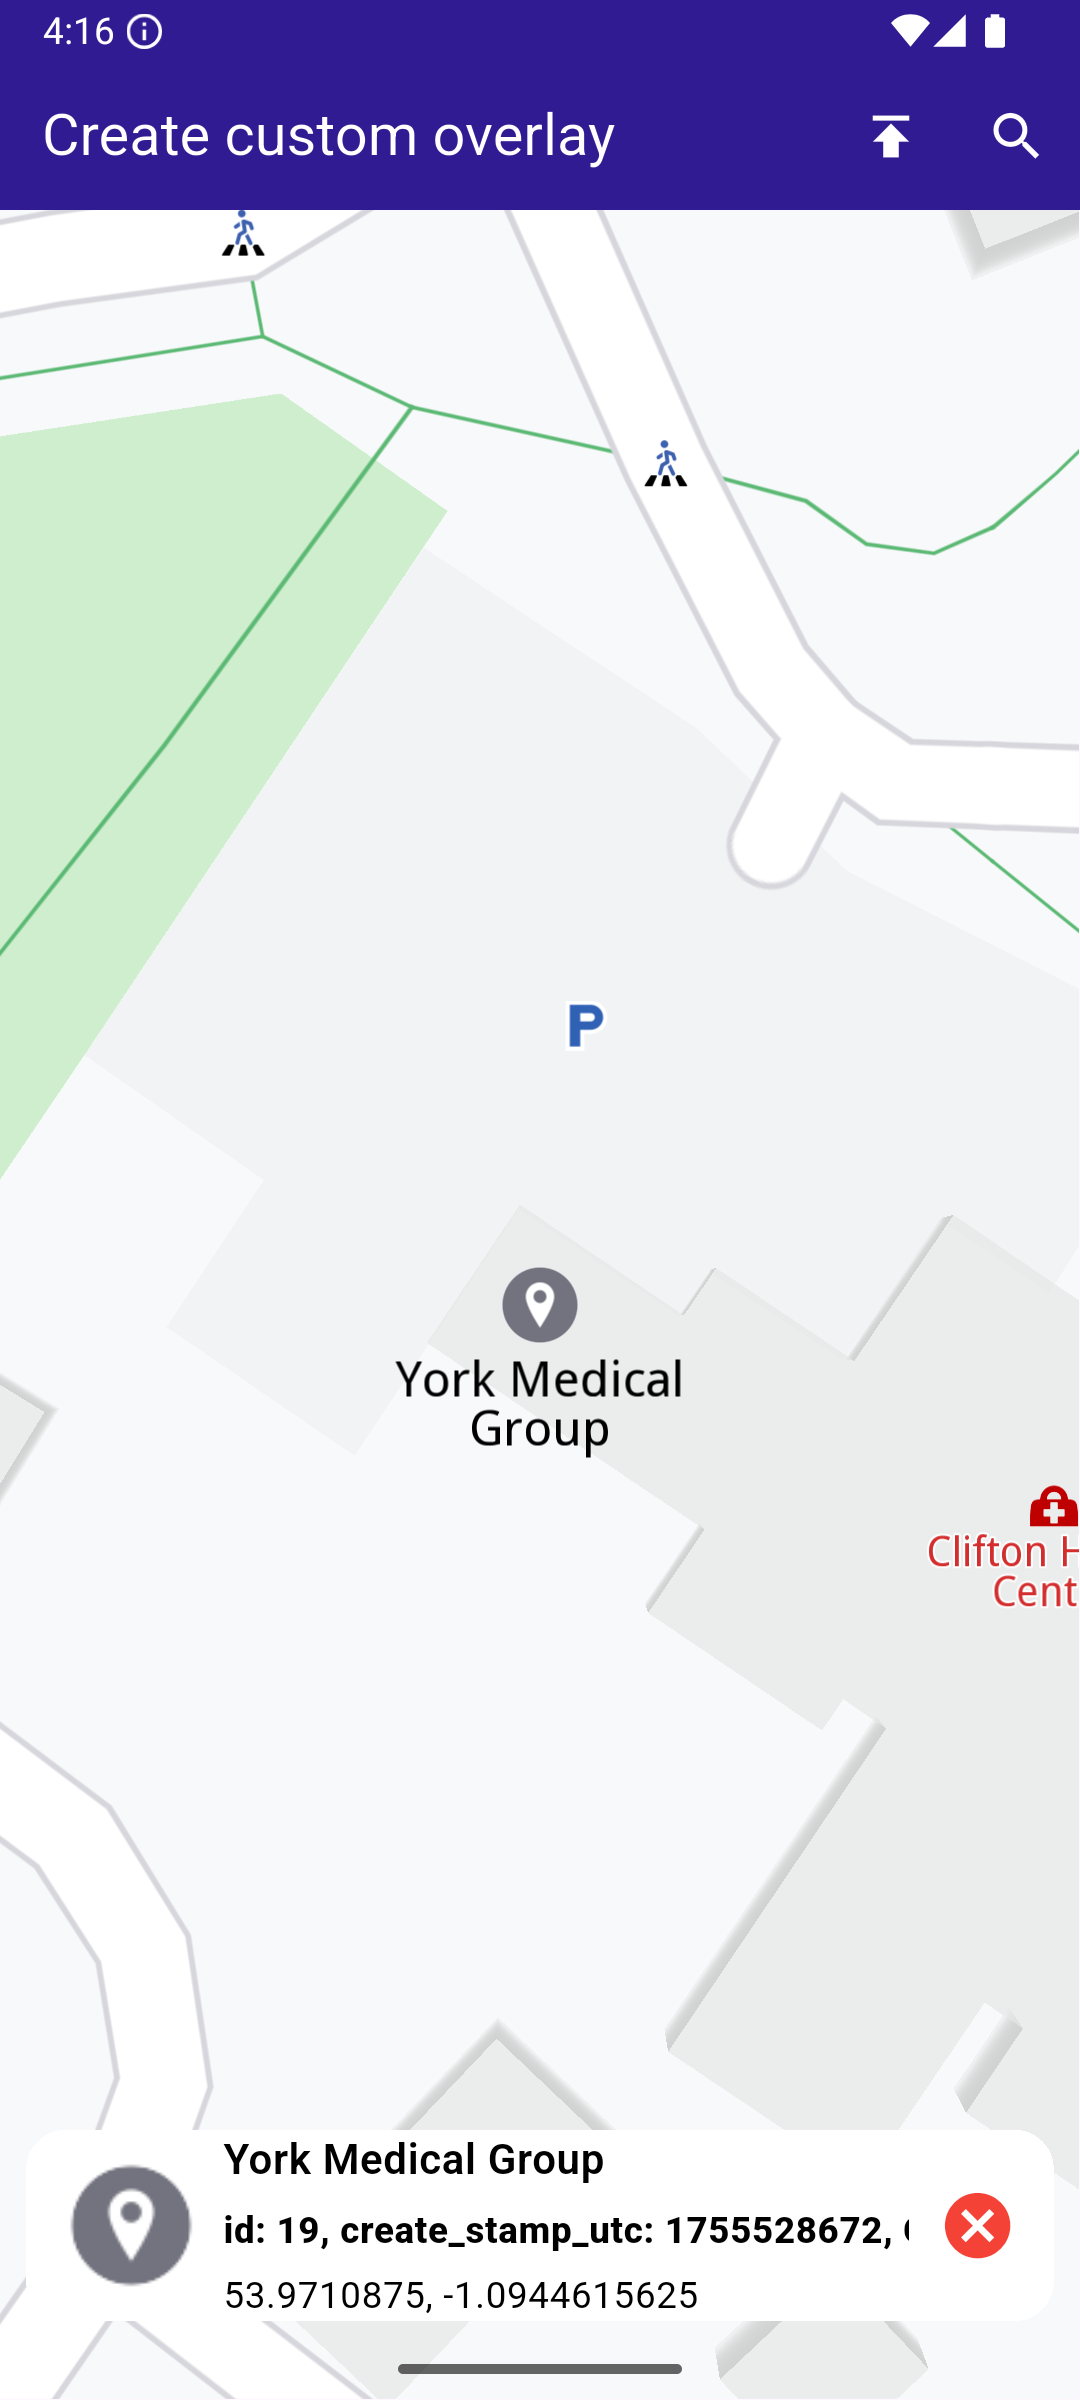
Overlay Item Panel
The overlay item panel is responsible for presenting detailed information about the currently selected item.
It retrieves and displays key attributes such as name, previewData, image, and geographic coordinates, and provides controls for closing the panel or taking actions related to the selected item.
import 'package:flutter/material.dart';
import 'package:magiclane_maps_flutter/map.dart';
class OverlayItemPanel extends StatelessWidget {
final VoidCallback onCancelTap;
final OverlayItem overlayItem;
const OverlayItemPanel({super.key, required this.onCancelTap, required this.overlayItem});
@override
Widget build(BuildContext context) {
return Container(
width: MediaQuery.of(context).size.width - 20,
padding: const EdgeInsets.symmetric(horizontal: 5),
margin: const EdgeInsets.symmetric(horizontal: 10),
decoration: BoxDecoration(color: Colors.white, borderRadius: BorderRadius.circular(15)),
child: Row(
children: [
Container(
padding: const EdgeInsets.symmetric(horizontal: 10),
child: overlayItem.img.isValid
? Image.memory(overlayItem.img.getRenderableImageBytes(size: Size(50, 50))!)
: SizedBox(),
),
Row(
mainAxisAlignment: MainAxisAlignment.spaceBetween,
children: [
SizedBox(
width: MediaQuery.of(context).size.width - 150,
child: Row(
children: [
SizedBox(
width: MediaQuery.of(context).size.width - 150,
child: Column(
mainAxisAlignment: MainAxisAlignment.center,
crossAxisAlignment: CrossAxisAlignment.start,
children: [
Text(
overlayItem.name,
maxLines: 2,
overflow: TextOverflow.ellipsis,
style: const TextStyle(color: Colors.black, fontSize: 16, fontWeight: FontWeight.w600),
),
const SizedBox(height: 5),
SingleChildScrollView(
scrollDirection: Axis.horizontal,
child: Text(
overlayItem.previewDataParameterList.map((kv) => '${kv.key}: ${kv.value}').join(', '),
overflow: TextOverflow.ellipsis,
style: const TextStyle(color: Colors.black, fontSize: 14, fontWeight: FontWeight.w800),
),
),
const SizedBox(height: 5),
Text(
'${overlayItem.coordinates.latitude.toString()}, ${overlayItem.coordinates.longitude.toString()}',
maxLines: 2,
overflow: TextOverflow.visible,
style: const TextStyle(color: Colors.black, fontSize: 14, fontWeight: FontWeight.w400),
),
],
),
),
],
),
),
SizedBox(
width: 50,
child: Column(
mainAxisAlignment: MainAxisAlignment.start,
children: [
Align(
alignment: Alignment.topRight,
child: IconButton(
padding: EdgeInsets.zero,
onPressed: onCancelTap,
icon: const Icon(Icons.cancel, color: Colors.red, size: 30),
),
),
],
),
),
],
),
],
),
);
}
}
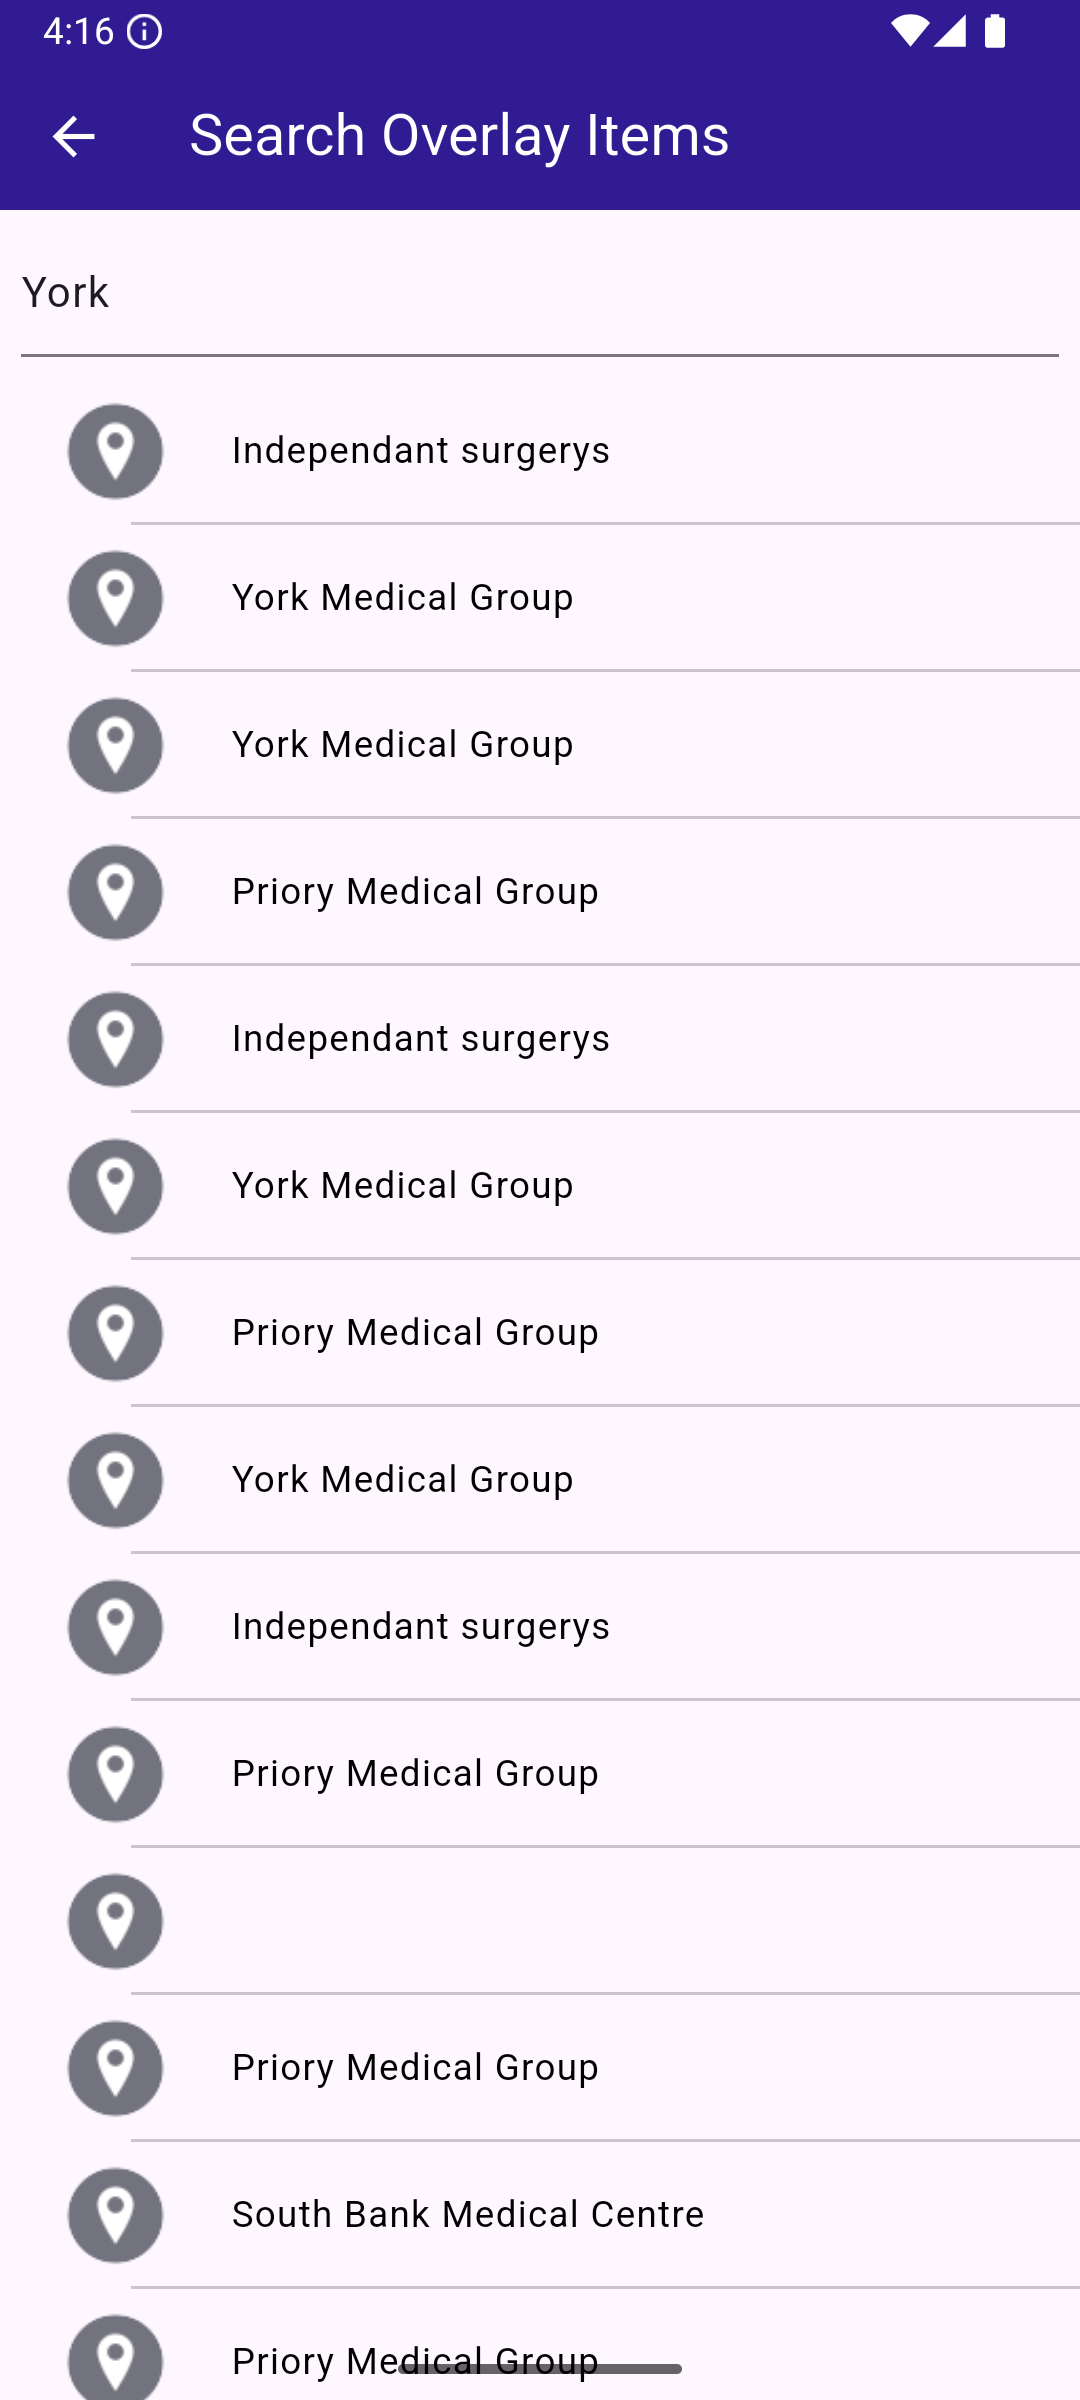
Search Page
The search page component handles querying landmarks using SearchService.
It applies the SearchPreferences configured in the main app, ensuring that search results are limited to the custom overlay.
Search results are presented in a scrollable list, and selecting a result returns it to the calling screen for highlighting and map centering.
import 'package:magiclane_maps_flutter/core.dart';
import 'package:magiclane_maps_flutter/map.dart';
import 'package:magiclane_maps_flutter/search.dart';
import 'package:flutter/material.dart';
import 'dart:async';
class SearchPage extends StatefulWidget {
final Coordinates coordinates;
final SearchPreferences preferences;
const SearchPage({
super.key,
required this.coordinates,
required this.preferences,
});
@override
State<SearchPage> createState() => _SearchPageState();
}
class _SearchPageState extends State<SearchPage> {
List<OverlayItem> overlayItems = [];
@override
Widget build(BuildContext context) {
return Scaffold(
appBar: AppBar(
automaticallyImplyLeading: true,
title: const Text(
"Search Overlay Items",
style: TextStyle(color: Colors.white),
),
backgroundColor: Colors.deepPurple[900],
foregroundColor: Colors.white,
),
body: Column(
children: [
Padding(
padding: const EdgeInsets.all(8.0),
child: TextField(
onSubmitted: (value) => _onSearchSubmitted(value),
cursorColor: Colors.deepPurple[900],
decoration: const InputDecoration(
hintText: 'Hint: York',
hintStyle: TextStyle(color: Colors.black),
focusedBorder: UnderlineInputBorder(
borderSide: BorderSide(color: Colors.deepPurple, width: 2.0),
),
),
),
),
Expanded(
child: ListView.separated(
padding: EdgeInsets.zero,
itemCount: overlayItems.length,
controller: ScrollController(),
separatorBuilder: (context, index) =>
const Divider(indent: 50, height: 0),
itemBuilder: (context, index) {
final lmk = overlayItems.elementAt(index);
return SearchResultItem(overlayItem: lmk);
},
),
),
],
),
);
}
void _onSearchSubmitted(String text) {
search(text, widget.coordinates, preferences: widget.preferences);
}
Future<void> search(
String text,
Coordinates coordinates, {
SearchPreferences? preferences,
}) async {
Completer<List<OverlayItem>> completer = Completer<List<OverlayItem>>();
SearchService.search(text, coordinates, preferences: preferences, (
err,
results,
) async {
if (err != GemError.success) {
completer.complete([]);
return;
}
final overlayItems = results.map((lmk) => lmk.overlayItem).where((item) => item != null).cast<OverlayItem>().toList();
if (!completer.isCompleted) completer.complete(overlayItems);
});
final result = await completer.future;
setState(() {
overlayItems = result;
});
}
}
class SearchResultItem extends StatefulWidget {
final OverlayItem overlayItem;
const SearchResultItem({super.key, required this.overlayItem});
@override
State<SearchResultItem> createState() => _SearchResultItemState();
}
class _SearchResultItemState extends State<SearchResultItem> {
@override
Widget build(BuildContext context) {
return ListTile(
onTap: () => Navigator.of(context).pop(widget.overlayItem),
leading: Container(
padding: const EdgeInsets.all(8),
child: widget.overlayItem.img.isValid
? Image.memory(
widget.overlayItem.img.getRenderableImageBytes(
size: Size(50, 50),
)!,
)
: SizedBox(),
),
title: Text(
widget.overlayItem.name,
overflow: TextOverflow.fade,
style: const TextStyle(
color: Colors.black,
fontSize: 14,
fontWeight: FontWeight.w400,
),
maxLines: 2,
),
);
}
}
Selected overlay item with panel