# Magic Lane Documentation
## Docs
### Get Started
Last updated:
October 13, 2026
| 3 minutes read
In this guide you will learn how to create your free Magic Lane account and your first project, and how to get your API Key.
Warning
Ensure that the API key remains secure and is not exposed. If the key is compromised or its integrity is uncertain, promptly revoke it and generate a new one to maintain security and prevent unauthorized usage that may incur additional costs.
#### Create your account[](#create-your-account "Direct link to Create your account")
Go to the Magic Lane [registration/sign up page](https://developer.magiclane.com/api/register) to create a free account.
You only need to type in your email address and choose a new password. Optionally, you can also enter your name and company.

**Register**
Click the `Get started` button after reviewing the terms of service and privacy policy. You will get a confirmation email with a link to activate your account. After you activate your account by clicking on the link you received, you can sign in!
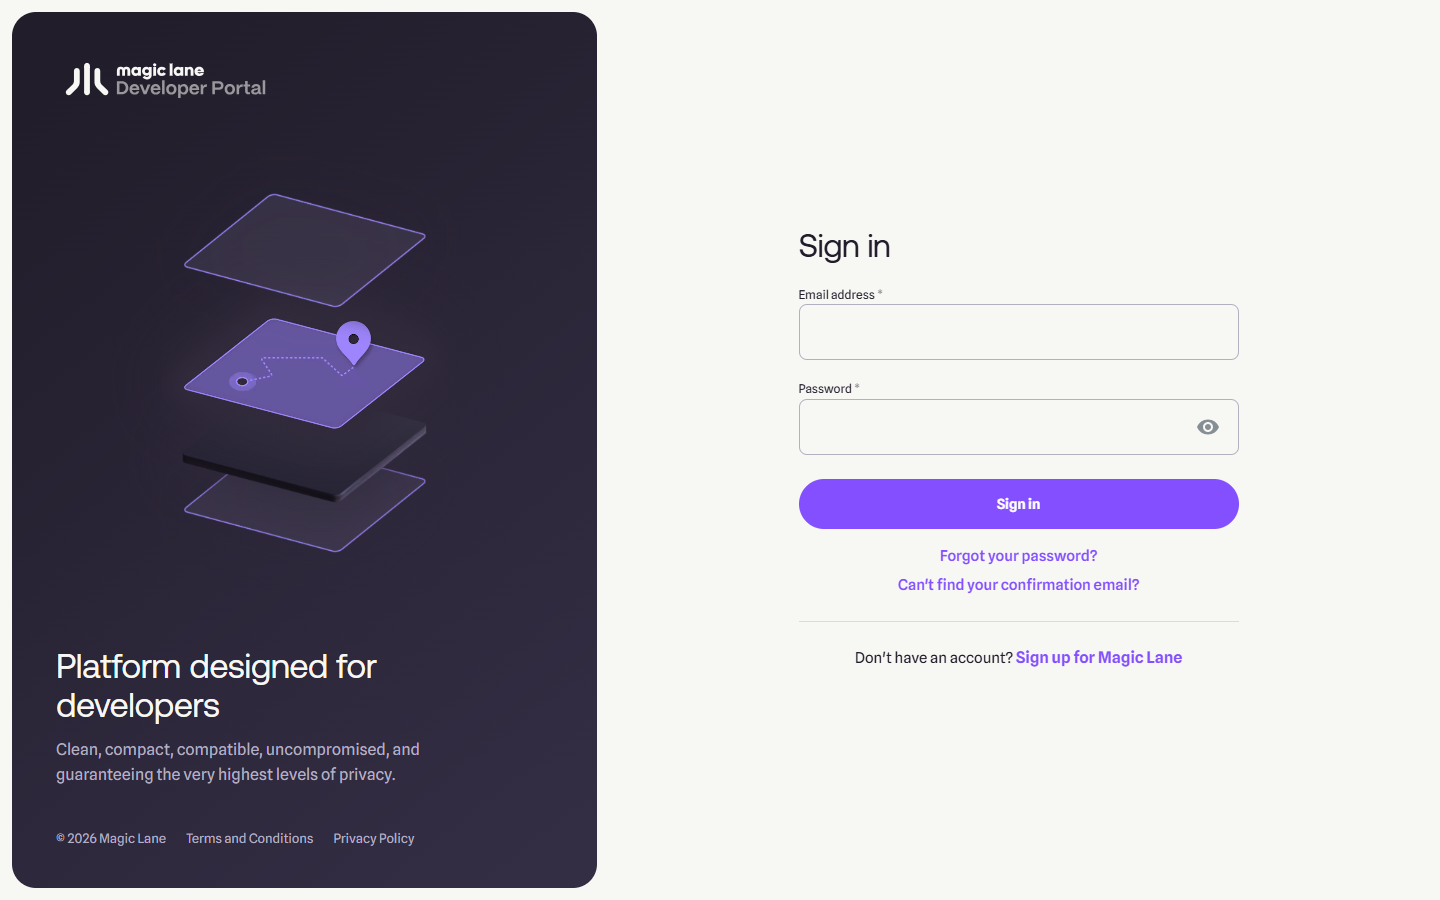
**Sign in**
Go to the Magic Lane [login page](https://developer.magiclane.com/api/login) to sign in to your new account. Type your complete email address, which you used to create the account, and the password you created when you signed up in the previous step.
#### Create a project[](#create-a-project "Direct link to Create a project")
Once logged in, you are on your [Dashboard](https://developer.magiclane.com/api/dashboard) page. Click the [Projects](https://developer.magiclane.com/api/projects) tab.
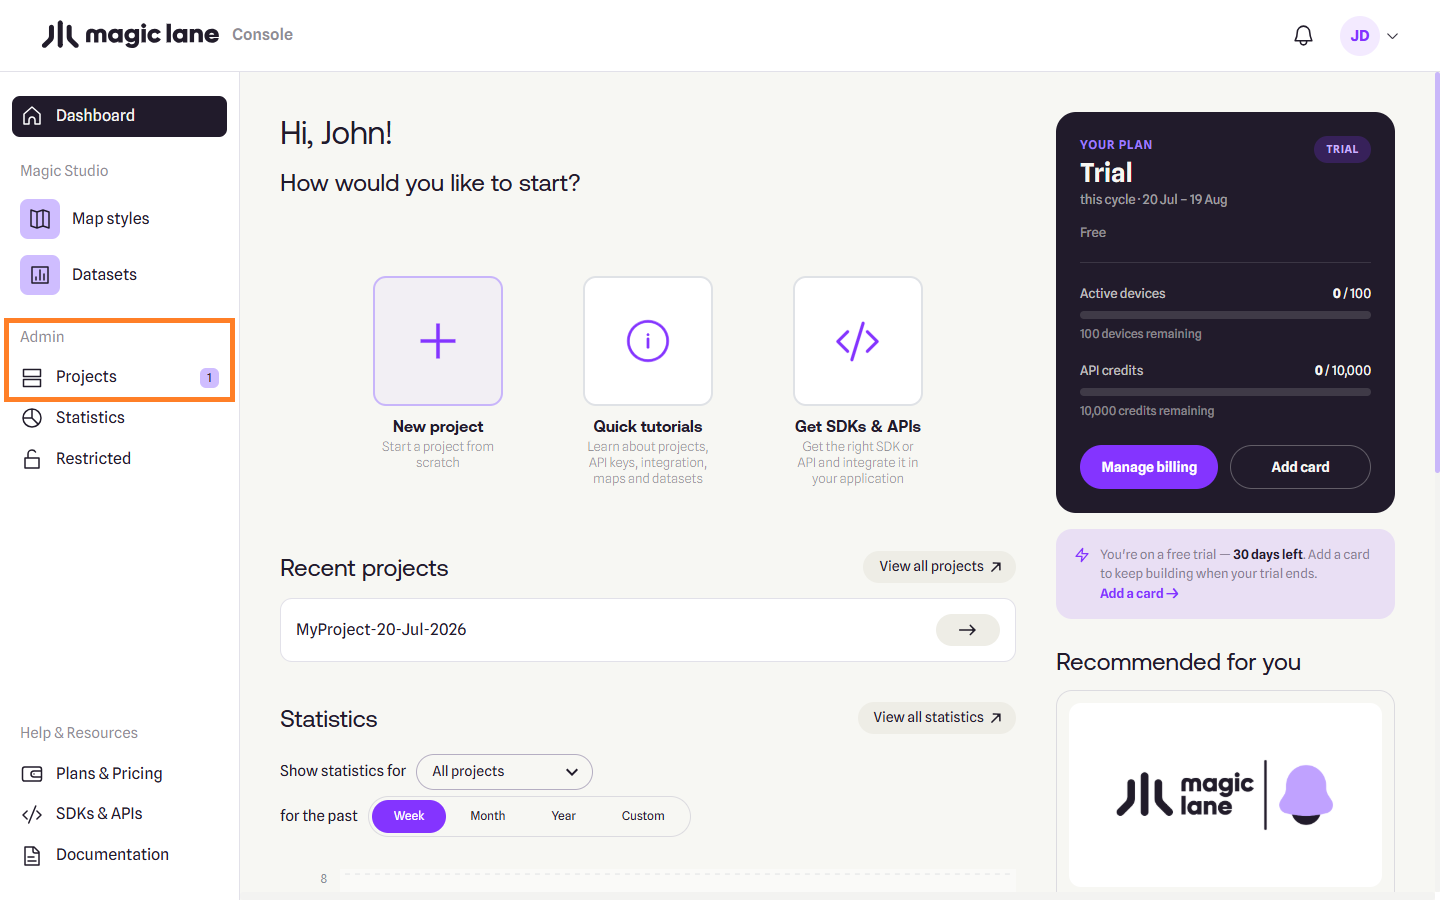
**Projects**
On the My Projects page, click the `Create project` button from the top-right side of the page.
A dialog appears, where you can type a name for the new project, and a short description. When done, click `Create project`.
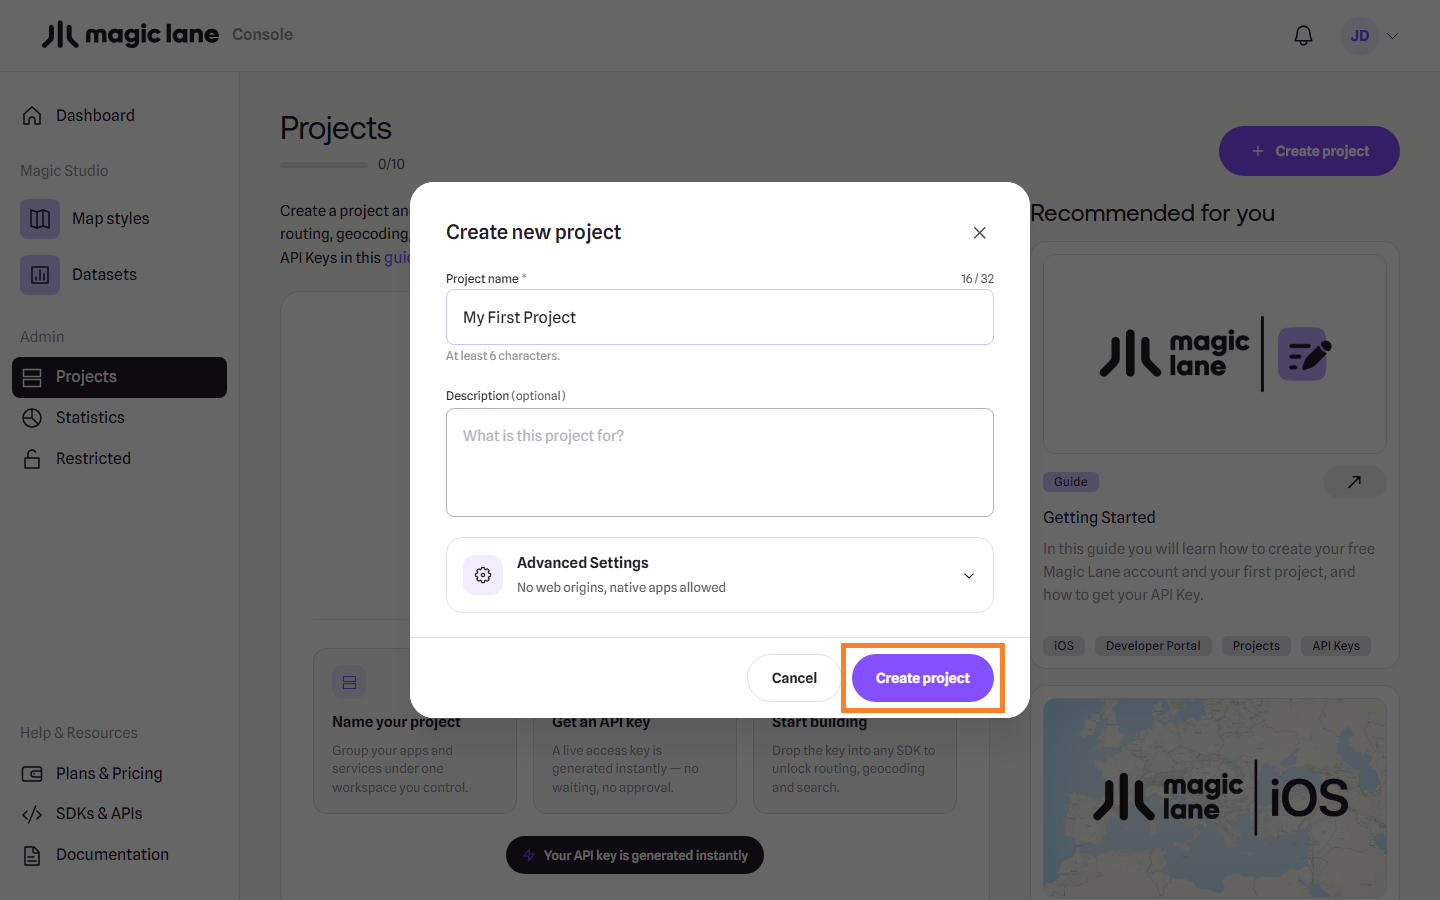
**Create project modal**
#### Create an API Key[](#create-an-api-key "Direct link to Create an API Key")
The project is created with an API key with a short expiration date.
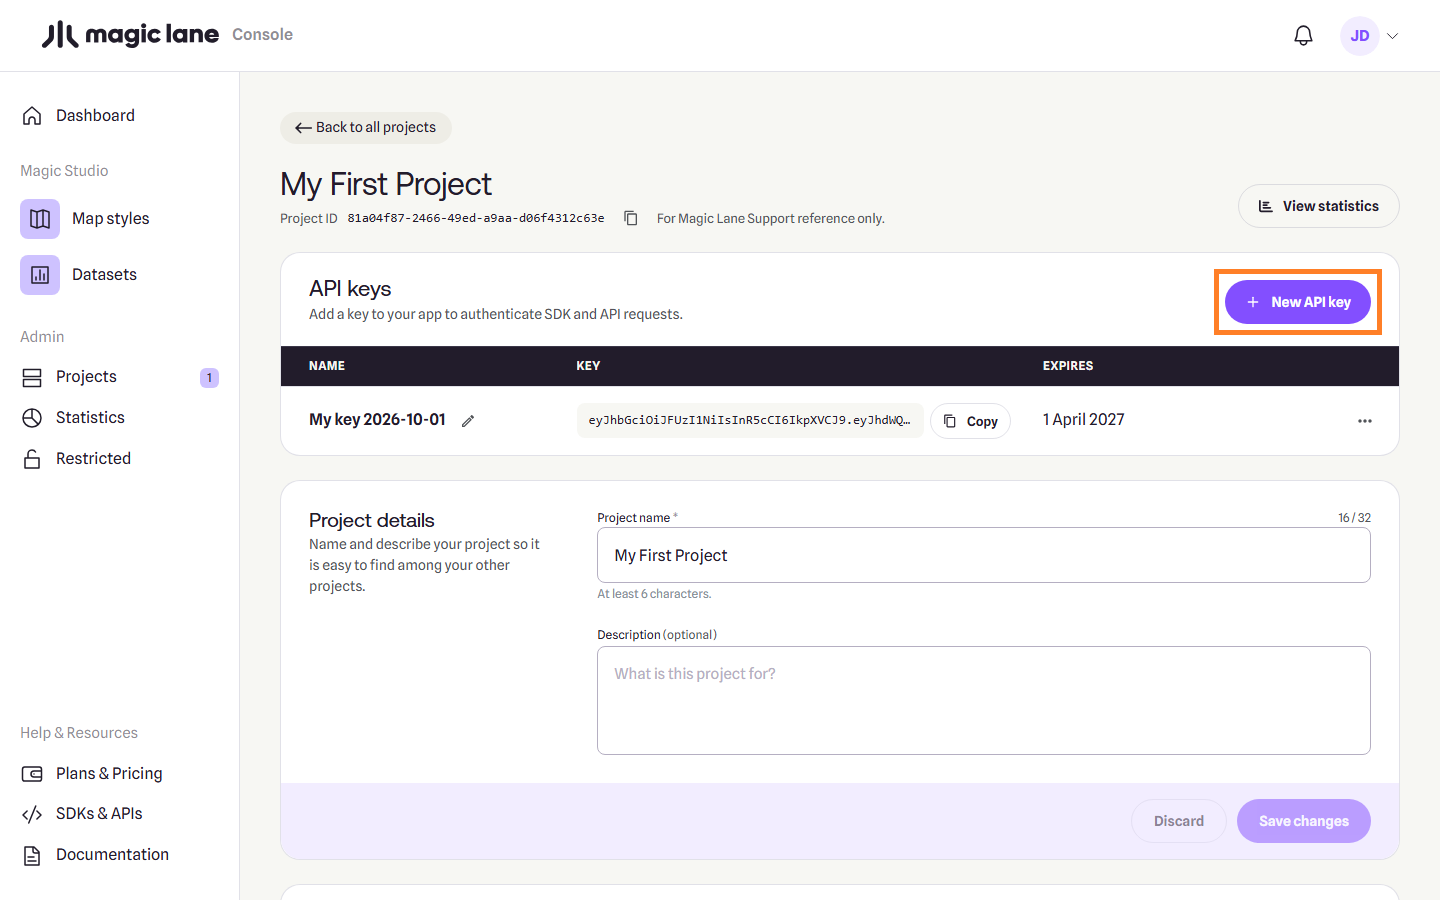
**Project API Keys**
Click `Generate additional API Key` to create another key for your project, where you can set an expiration date further into the future.
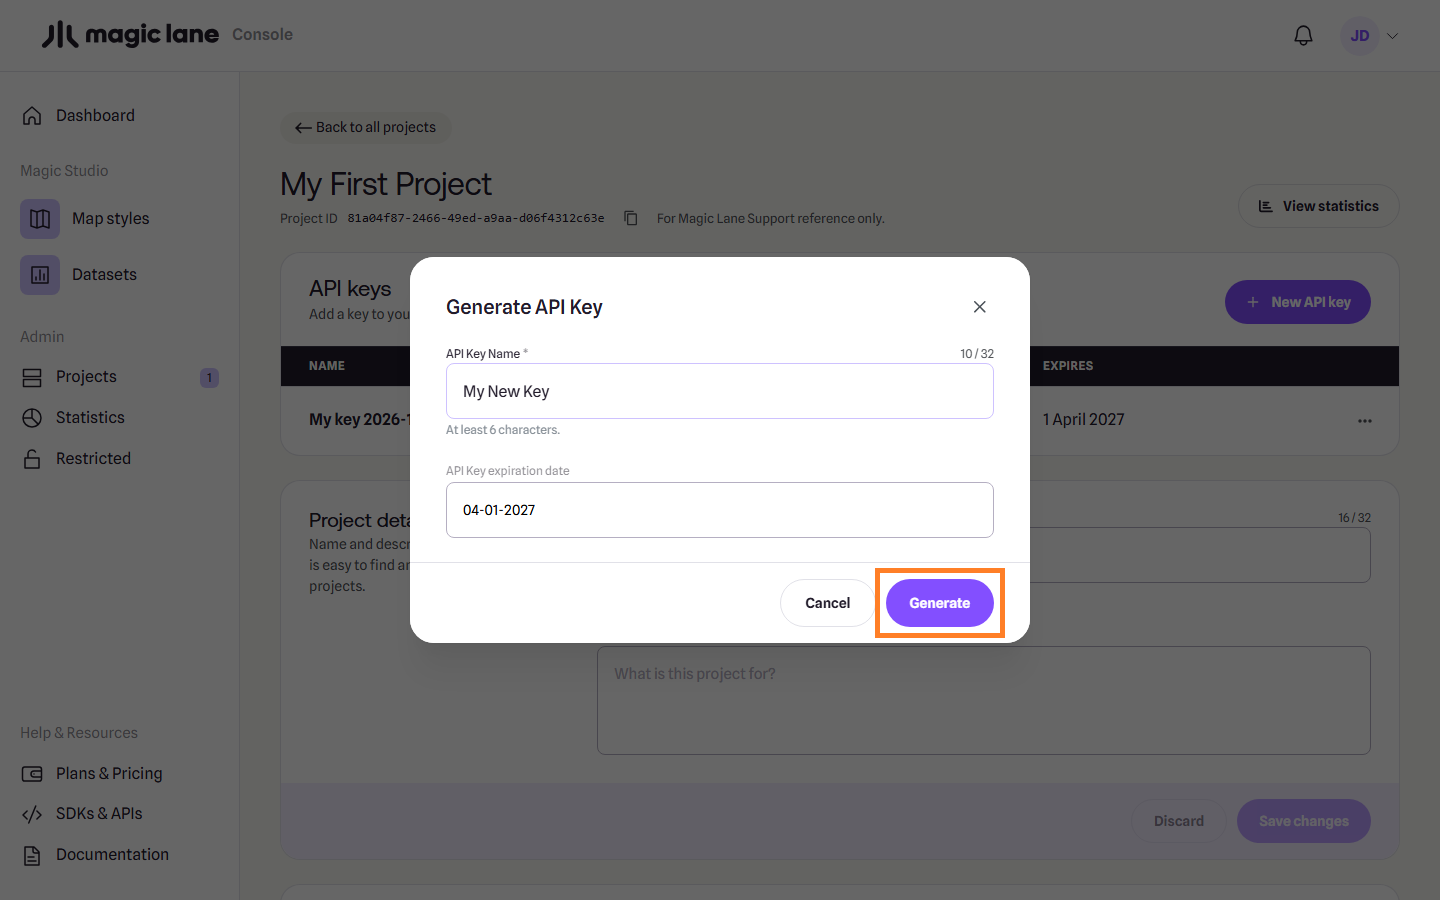
**Generate API Key modal**
You can give the new API key a different name, and set any expiration date you want. Click `Generate` to generate the API key.
Warning
Ensure that key management is properly planned and that the key on the client’s device is updated before its expiration date. Failure to do so will result in a watermark being displayed on the map and certain features becoming limited once the key has expired.
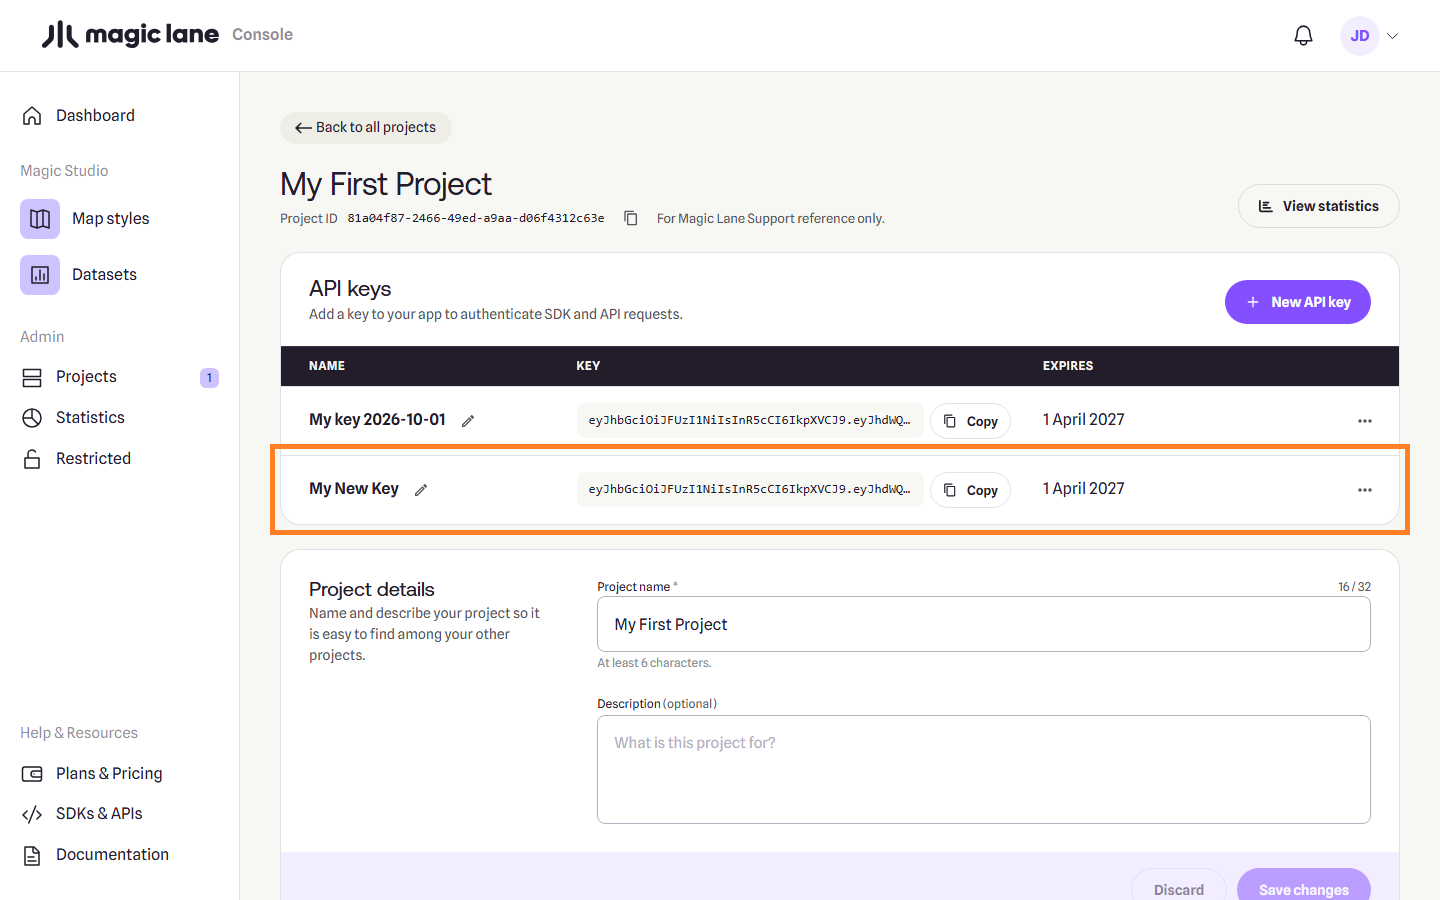
**Project page**
You just created your first project and Magic Lane API Key !
You can click on the copy button to the right of the API Key to copy it, and then paste it in your code.
---
### Magic Lane Studio
[v](/docs/guides/map-studio/CHANGELOG/)
[1.0.0 Release notes →](/docs/guides/map-studio/CHANGELOG/)
Magic Lane Studio is the web editor for Magic Lane map styles. Open a style from the portal, change how the map looks against a live map, and download the file your app loads. Every change is saved as you work, and every change to the style can be undone.
Studio shows the map the way people describe it, as land, water, roads, place labels and points of interest, and lets you edit it layer by layer: zoom ranges, colours that change with zoom, text, icons and data filters. A style can carry its own font for its labels. Shared colours change every layer that uses a colour at once, and themes keep several colour sets, such as Day and Night, in one style. You can add your own data by drawing on the map or uploading GeoJSON, line-delimited GeoJSON, CSV, TSV, KML or GPX files.
Styles made with Magic Lane Studio work with every Magic Lane Maps SDK. [Download and use in your app](/docs/guides/map-studio/getting-started/download-and-use.md) shows how to load a style.
New to Studio? Start with the [Studio overview](/docs/guides/map-studio/getting-started/what-studio-is.md), then [Create a style](/docs/guides/map-studio/getting-started/create-a-style.md), [Opening and saving](/docs/guides/map-studio/getting-started/opening-and-saving.md), [A tour of the editor](/docs/guides/map-studio/getting-started/what-studio-is.md#a-tour-of-the-editor) and [Download](/docs/guides/map-studio/getting-started/download-and-use.md).
#### In this guide[](#in-this-guide "Direct link to In this guide")
* **[Getting started](/docs/guides/map-studio/getting-started.md)**: an overview of Studio, creating a style, opening and saving, and downloading the style for your app.
* **[Tutorials](/docs/guides/map-studio/tutorials.md)**: two step-by-step walkthroughs, a first style in 10 minutes and putting your own data on the map.
* **[Editing a style](/docs/guides/map-studio/editing.md)**: every screen of the editor, from the layer list and the Properties column to shared colours, themes, images, the map and history.
* **[Your own data](/docs/guides/map-studio/data.md)**: uploading and drawing your own points, lines and areas.
* **[Reference](/docs/guides/map-studio/reference.md)**: keyboard shortcuts, errors and the glossary, and for developers the style file format, map data sources and layer types.
* **[Changelog](/docs/guides/map-studio/CHANGELOG/)**: what changed in each version.
---
### Your own data
#### [📄️Data sources](/docs/guides/map-studio/data/data-sources.md)
[A data source is your own set of points, lines or areas, uploaded from a file or drawn on the map. Studio saves it to your account, the server cuts it into tiles, and a layer in your style draws it.](/docs/guides/map-studio/data/data-sources.md)
---
### Data sources
Last updated:
October 13, 2026
| 10 minutes read
A data source is your own set of points, lines or areas, uploaded from a file or drawn on the map. Studio saves it to your account, the server cuts it into tiles, and a layer in your style draws it.
#### Step by step[](#step-by-step "Direct link to Step by step")
##### Upload a file and use it on the map[](#upload-a-file-and-use-it-on-the-map "Direct link to Upload a file and use it on the map")
1. On the Layers screen, open **Available Layers › Data Sources Layers** and click **+ Add** on the CUSTOM row. A new data source opens in the Properties column.
2. Type a name for it in the name field.
3. Click **Upload a data file**, then drop your file on the dropzone or click it to browse. When the panel says the file was parsed, click **Append**.
4. Click **Save**. The status line shows "◌ Tiling…", then "✔ Tiled — drag it into Selected Layers to use it."
5. Drag the source's row from CUSTOM into Selected Layers. A layer named after the source is added and selected, and the map moves to your data.
6. Style the new layer in the Properties column like any other layer.
##### Add a property and use it as a label[](#add-a-property-and-use-it-as-a-label "Direct link to Add a property and use it as a label")
1. Select the data source and click a feature in the FEATURES list.
2. On the feature's card, click **Add new property**, type a name such as `name` and a value, and click **Confirm**.
3. Click **Save** and wait for "✔ Tiled".
4. Select the layer that draws the source. On a symbol layer, the Text Field editor now offers `name` under "Fields on this layer's data"; the Data Filter tab offers it too.
##### Delete a data source[](#delete-a-data-source "Direct link to Delete a data source")
1. Right-click its row in CUSTOM and choose **Delete…**.
2. If layers in the style draw from it, leave **Also delete the layer…** ticked to remove them too.
3. Click **Delete**. The data source cannot be restored; `Ctrl+Z` (`⌘Z` on Mac) brings back only the layers.
#### What a data source is[](#what-a-data-source-is "Direct link to What a data source is")
Most of what a style draws is the base map served by Magic Lane; a data source is the part that is yours. It lives in your account, not in the style. Editing it does not mark the style unsaved, does not enter the style's history, and `Ctrl+Z` does not undo it.
A data source holds one kind of feature: points, lines or areas. Until you save it, it exists only in this browser tab. Saving sends it to the server, which cuts it into tiles; only then can a layer draw it.
#### The CUSTOM list[](#the-custom-list "Direct link to The CUSTOM list")
Your data sources are listed under **Available Layers › Data Sources Layers › CUSTOM**. It starts collapsed.
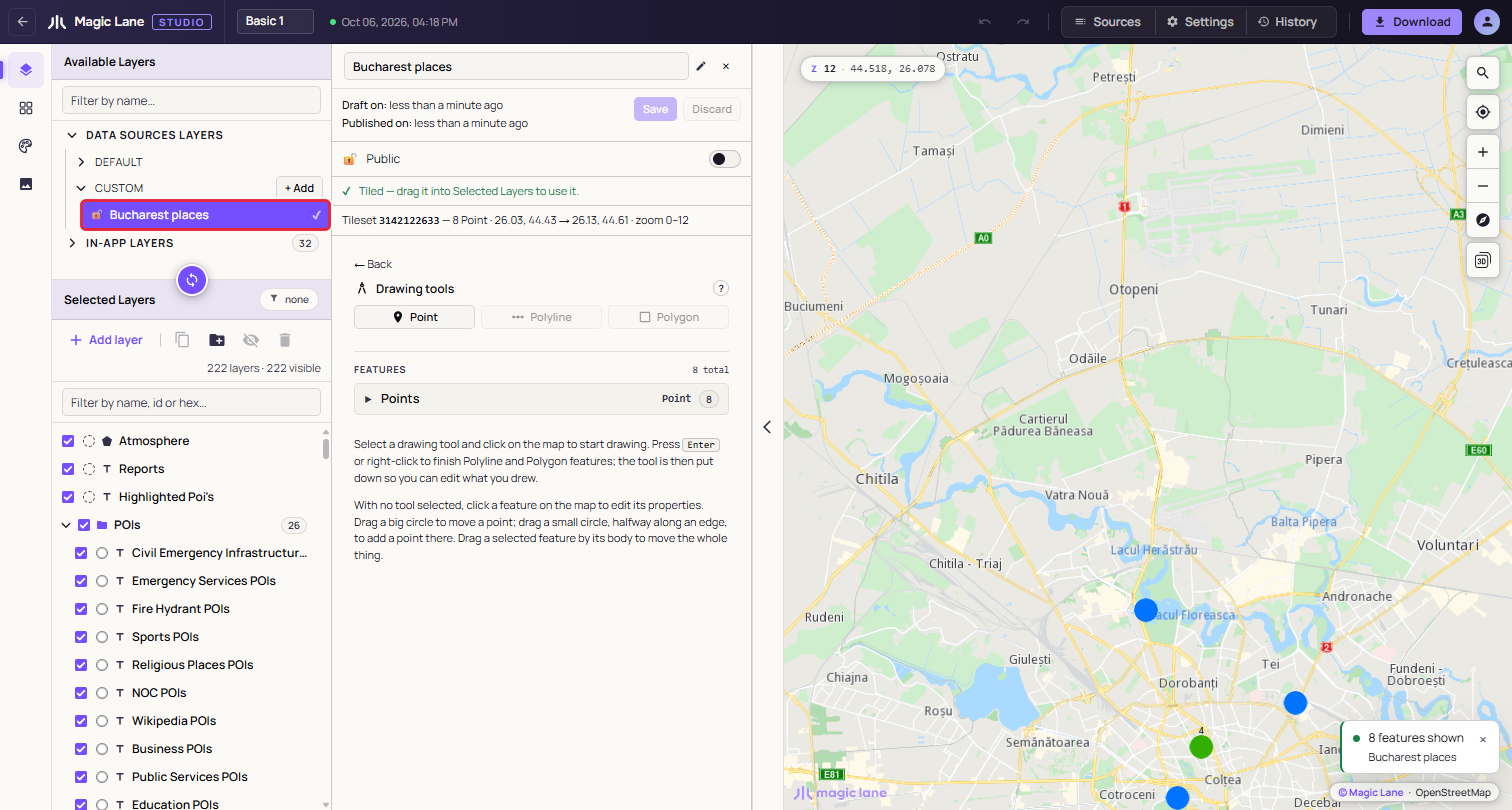
**A saved and tiled data source. The tick means tiling has finished.**
Each row shows a lock (open for public, closed for private), the name, "IN USE" when the selected layer draws from it, and a status mark: ✔ when tiled, ◌ while tiling, nothing if it was never saved. Click a row to open it in the Properties column.
#### The data source panel[](#the-data-source-panel "Direct link to The data source panel")
**+ Add** creates a draft named after the moment it was made, such as "Data Source 01-10-2026 16:01:54", and opens it.
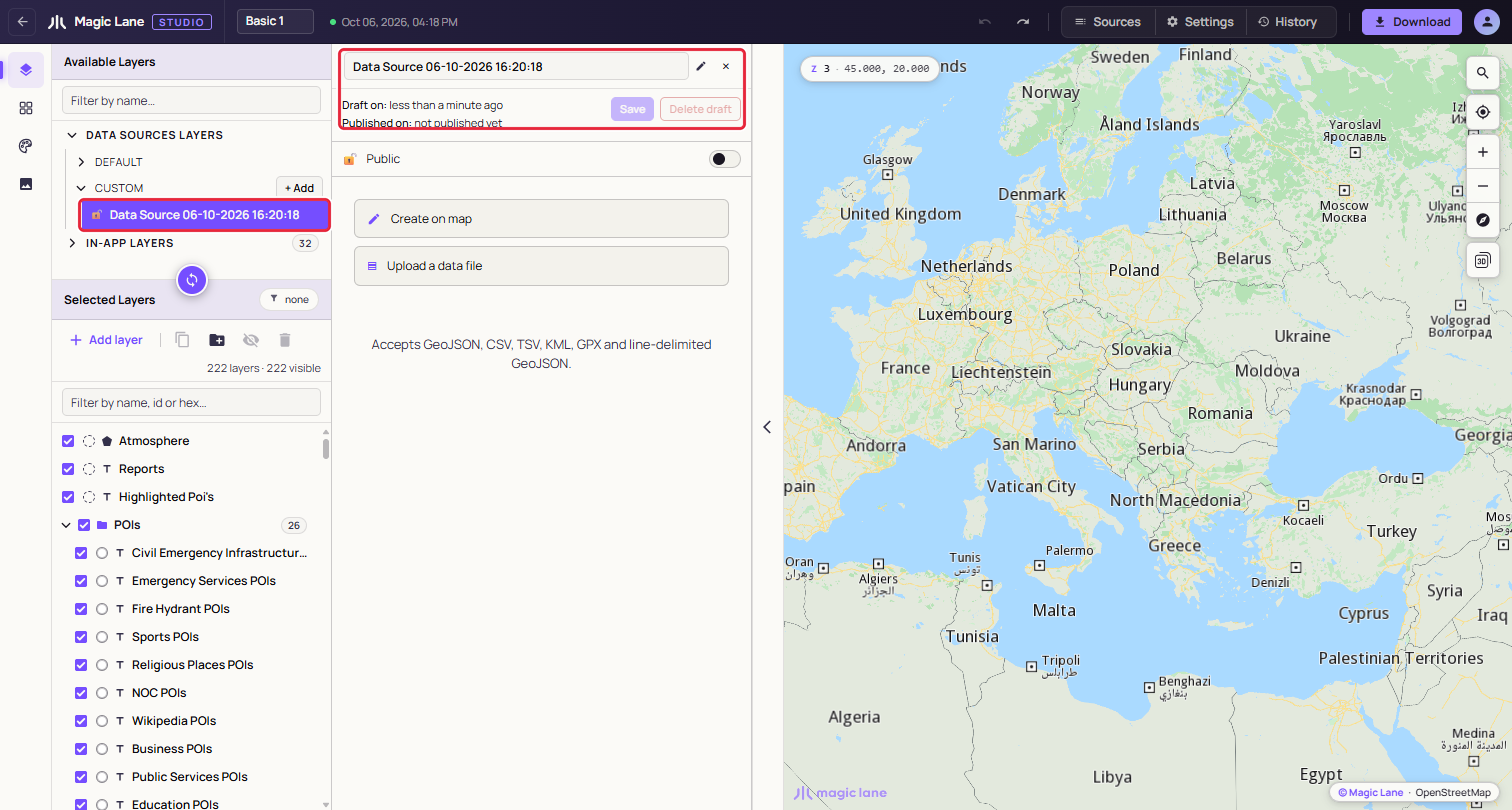
**A fresh draft. Nothing to save yet, so Save is disabled.**
* **Name**: type to rename. A saved source is renamed on the server by itself, half a second after you stop typing; a draft's name goes with the next Save. An empty name becomes "Untitled".
* **Draft on / Published on**: when the source was last changed, and when tiling last finished.
* **Save**: sends the features to the server and starts tiling.
* **Discard**: goes back to the last saved version. On a source that was never saved it reads **Delete draft**, and a second click on "Delete N features" removes the draft and everything in it, with no undo.
* **Public / Private**: which apps can draw the source; see [Public and private](#public-and-private). New sources start as Public. Under the switch, "Used by 3 layers in this style." counts the layers of this style that draw the source.
* **Status line**: tiling progress, then "✔ Tiled" once the source can be dragged in.
An empty source offers two buttons: **Create on map** opens the drawing tools (see [Drawing on the map](/docs/guides/map-studio/data/drawing-on-the-map.md)), and **Upload a data file** opens the upload panel. "← Back" returns to this choice.
##### Public and private[](#public-and-private "Direct link to Public and private")
The switch decides which apps can draw the source's layers:
* **Public**: the layers draw in any app that shows the style.
* **Private**: the source is served only to API keys from your account. In your own apps its layers draw as usual; in an app that uses someone else's API key they are empty, and nothing reports an error.
While a source used by this style is private, the line under the switch adds "They only draw in apps that use an API key from your account." Before you give the style to a customer or a partner, make the sources it uses public. The Download dialog warns when the style uses a private source; see [Private data sources](/docs/guides/map-studio/getting-started/download-and-use.md#private-data-sources).
#### Uploading a file[](#uploading-a-file "Direct link to Uploading a file")
Drop one file on the dropzone, or click it to browse. Studio reads the format from the file's extension:
* GeoJSON: `.geojson`, `.json` (a FeatureCollection, a single Feature or a bare geometry)
* Line-delimited GeoJSON: `.ndjson`, `.geojsonl`, `.jsonl`
* CSV and TSV: `.csv`, `.tsv`
* KML: `.kml` (Placemarks with points, lines and polygons; name, description and ExtendedData become properties)
* GPX: `.gpx` (waypoints become points; tracks and routes become lines)
**CSV and TSV.** The first row is the header, and every row becomes a point. The separator can be a comma, semicolon, pipe or tab. Studio looks for the coordinates in a column named `latitude`, `lat` or `y` and one named `longitude`, `lon`, `long` or `x`, written all in lower case or all in upper case (`lat` or `LAT`; `Lat` is not recognised). Write coordinates with a decimal point. A file without such columns fails with "Missing coordinates or coordinates format is invalid."
**Size.** We recommend files under 5 MB. Larger files work, but take longer to read and draw: Studio warns "File is very large. This will take some time to render." and waits for you to click **Continue** or **Abort**.
A file that fails the checks shows "This file could not be imported as-is." with the problems numbered, and nothing is imported.
##### Append, Replace or Cancel[](#append-replace-or-cancel "Direct link to Append, Replace or Cancel")
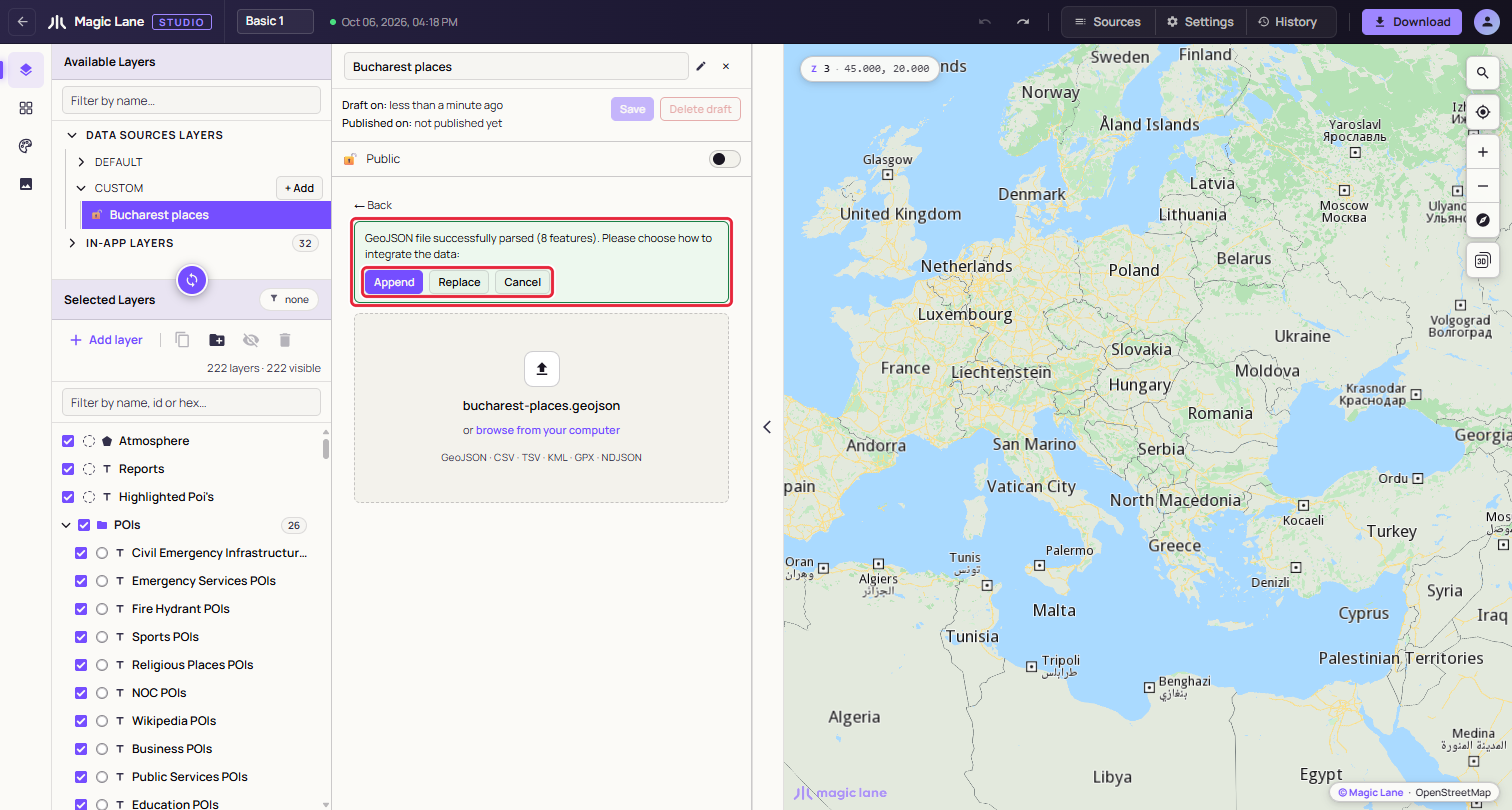
**A parsed file waits for your decision.**
* **Append** adds the file's features to what the source already holds.
* **Replace** uses the file instead of what the source holds. If the source has features, a second click on "Replace N features" is needed.
* **Cancel** forgets the file.
If the file's features are a different kind from the source's (lines into a source of points, say), only Replace is offered.
After Append or Replace the features are drawn on the map in blue, the map moves to fit them, and Save is enabled.
##### A file with several kinds of shape[](#a-file-with-several-kinds-of-shape "Direct link to A file with several kinds of shape")
A file that mixes points, lines and areas, such as a GPX with a track and waypoints, becomes one data source per kind. A dialog lists the parts before anything is created, with their names, the layer type that will draw each one and their counts; click **Create two data sources** (or three) to go ahead, or Cancel.
The parts are named after the file, for example "Utrecht Mixed Geometry · Areas", "· Lines" and "· Points". In CUSTOM they share one row with a badge and a caret. Collapsed, the row is dragged, renamed and deleted as one; expanded, each part can be used on its own. Renaming a part away from the "name · Areas" pattern makes it a separate row.
#### Saving and tiling[](#saving-and-tiling "Direct link to Saving and tiling")
Click **Save**. A notice says tiling has started, and the status line and the row show ◌. When the server finishes, the status becomes "✔ Tiled" and a notice says the source is ready. If tiling has not finished after ten minutes, Studio stops waiting and suggests reloading the page to check again.
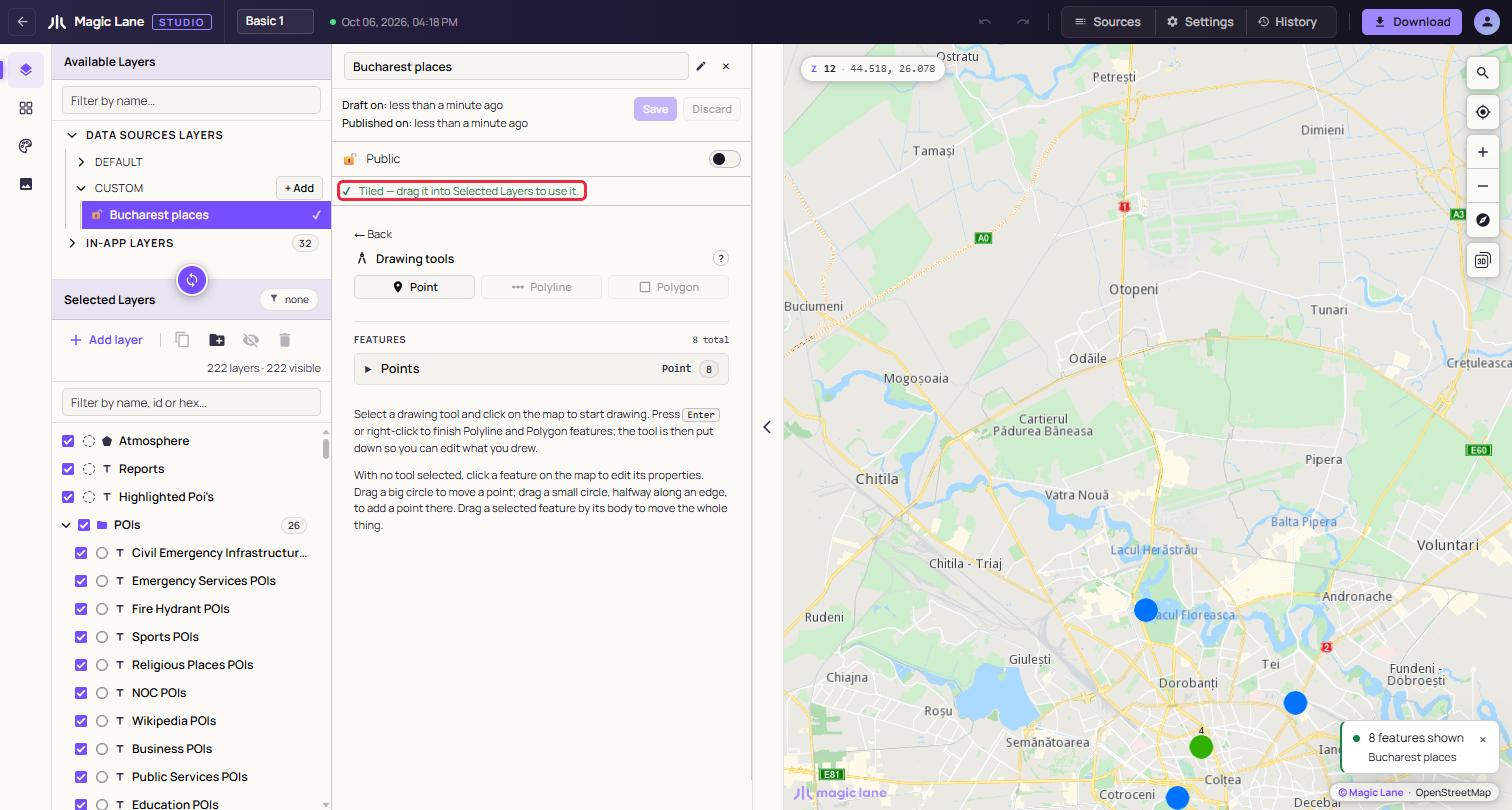
**A tiled source, ready to be dragged in.**
Saving an edited source keeps its tileset, and layers that draw it reload with the new data.
#### Adding it to the style[](#adding-it-to-the-style "Direct link to Adding it to the style")
Drag the tiled row from CUSTOM into Selected Layers, as with any layer (see [The layer list](/docs/guides/map-studio/editing/layer-tree.md)). A row that is not tiled yet cannot be dragged in; a notice says to save it or wait for tiling.
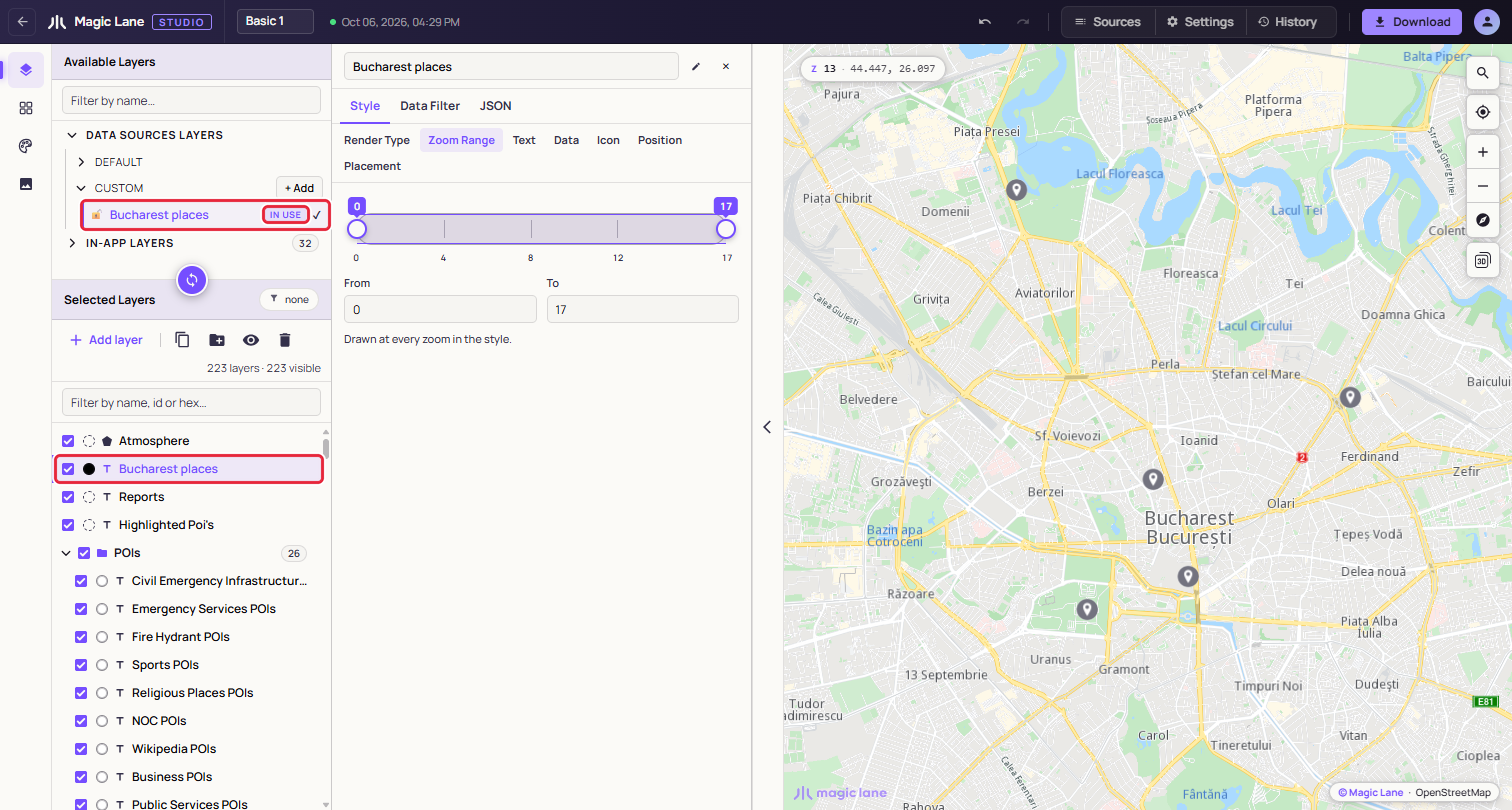
**The new layer is selected and named after the source, and the source row is marked IN USE.**
The layer's type follows the shapes: points become **Symbol**, lines **Line** and areas **Area**. To draw the data another way, change **Render Type** in the Properties column (see [Render Type](/docs/guides/map-studio/editing/property-panel.md#render-type)). A file split into parts adds one layer per part, in a group named after the source. Right-click the layer later and choose **Zoom to data** to return to the data.
#### Features and their properties[](#features-and-their-properties "Direct link to Features and their properties")
Under the drawing tools, the FEATURES list groups the source's features into Points, Lines and Areas, with counts. Each row shows the feature's `name` property, or "Feature 1", "Feature 2" and so on, and how many properties it has. A long group shows eight rows at a time, with "show 32 more" below. Sources with more than eight features get a **Filter features by name…** box.
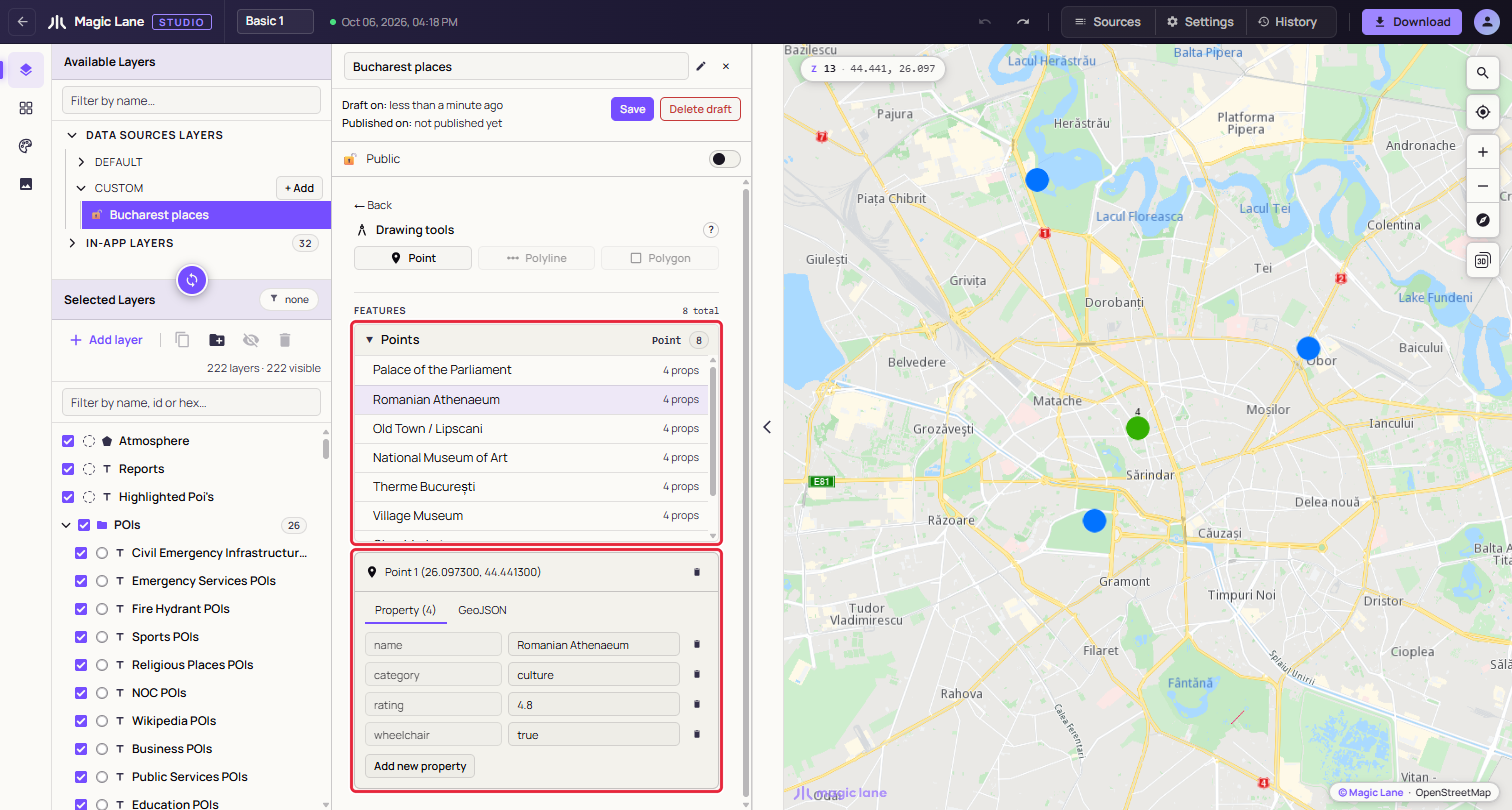
**A feature picked from the list. The map centres on it and its card opens below.**
Click a row, or click the feature on the map with no drawing tool in hand, to open its card. The card's bin deletes the feature immediately, with no undo. The card has two tabs:
* **Property**: one row per property, with an editable value and a bin. To rename a property, delete it and add it again. **Add new property** asks for a name and a value; a name the feature already has is refused with "Field already exists." Values are stored as text.
* **GeoJSON**: the feature as GeoJSON, read-only.
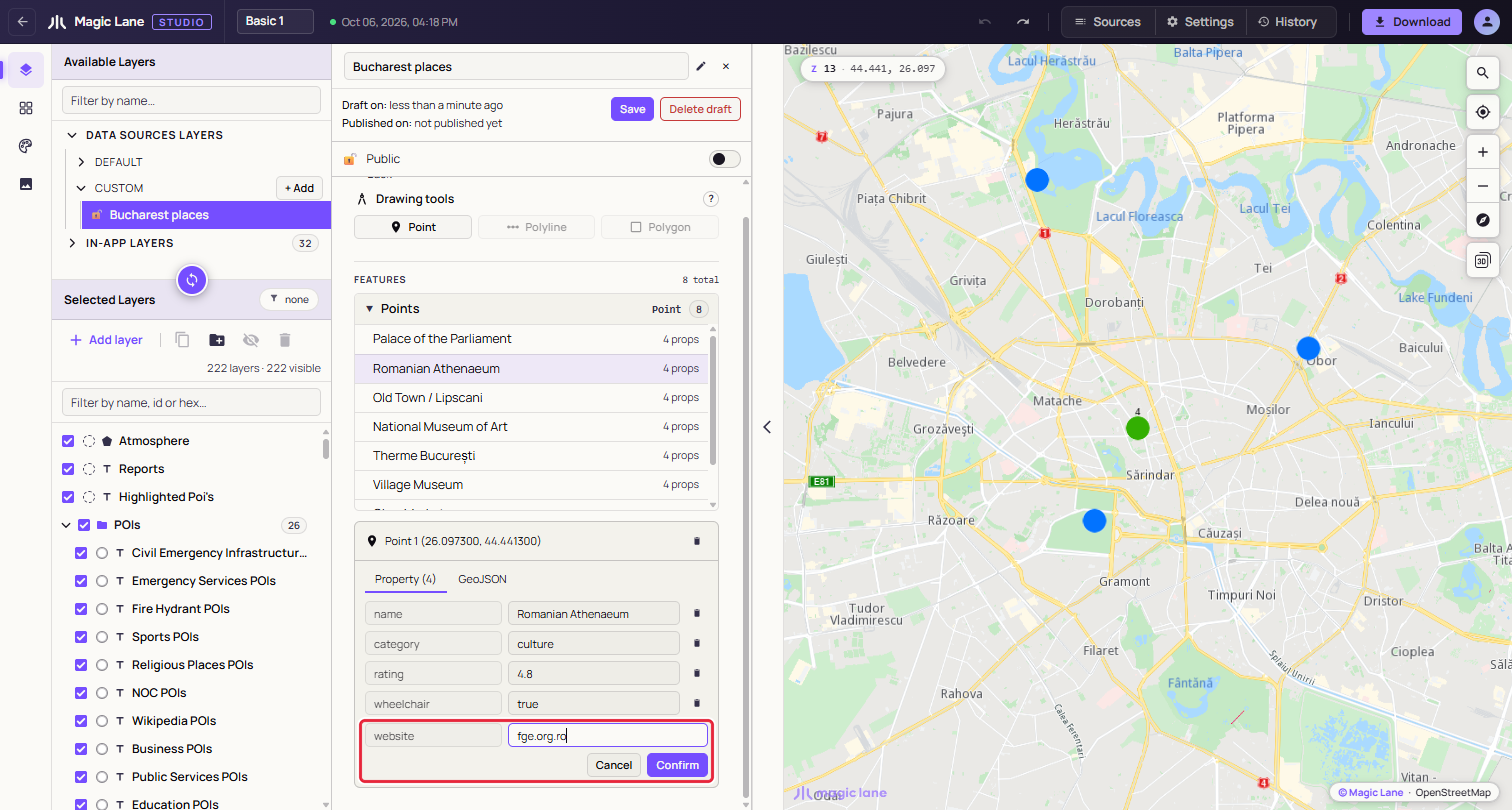
**Adding a property.**
Every change makes the source unsaved, and properties reach the style only after the next Save and tiling (see [Add a property and use it as a label](#add-a-property-and-use-it-as-a-label)). The map's click popup also lists them, with the `name`, `title` or `label` property as its heading.
#### Unsaved changes and deleting[](#unsaved-changes-and-deleting "Direct link to Unsaved changes and deleting")
**Leaving with unsaved changes.** If you select something else while a source has unsaved changes, Studio asks whether to save them: **Save**, **Discard** (back to the last saved version) or **Cancel** (stay as you are). For a source that was never saved, the middle button reads **Discard & delete**.
**Deleting.** The steps are under [Delete a data source](#delete-a-data-source).
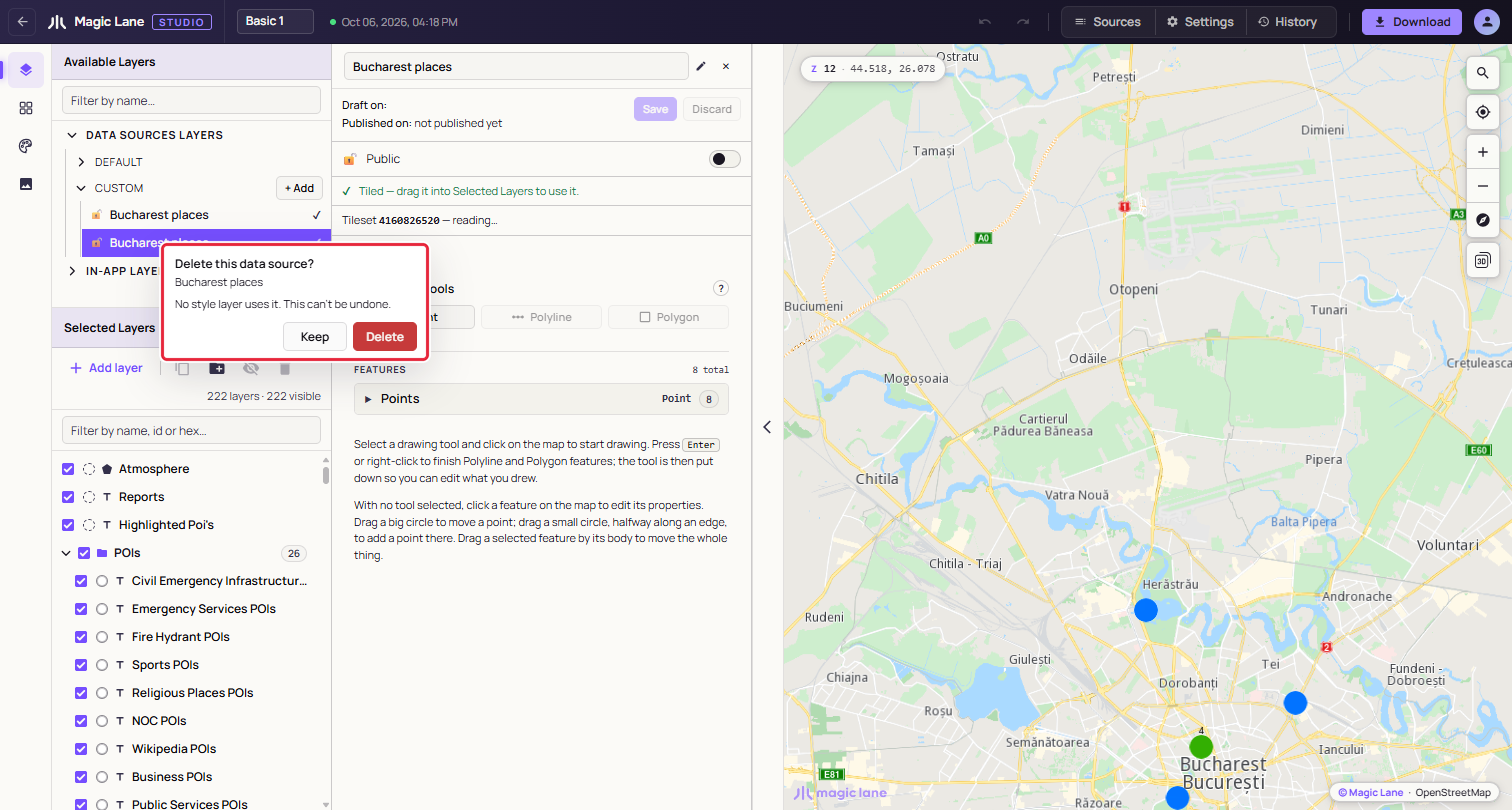
**Keep is focused first, so Enter cannot delete by accident.**
If you untick **Also delete the layer in this style that draws it**, the layers stay, marked "Source deleted", and may stop drawing at any time; delete them or point them at another source. A style must keep at least one layer, so the box is disabled when these are its only layers. On a split file's collapsed row, every part is deleted.
See also: [Drawing on the map](/docs/guides/map-studio/data/drawing-on-the-map.md) · [The layer list](/docs/guides/map-studio/editing/layer-tree.md) · [Put your own data on the map](/docs/guides/map-studio/tutorials/your-own-data.md)
---
### Drawing on the map
Last updated:
October 13, 2026
| 3 minutes read
With a data source selected, you can draw points, lines and areas straight onto the map and reshape them with handles.
#### Step by step[](#step-by-step "Direct link to Step by step")
##### Draw an area[](#draw-an-area "Direct link to Draw an area")
1. Select a data source in **Available Layers › Data Sources Layers › CUSTOM** (see [Data sources](/docs/guides/map-studio/data/data-sources.md)). If it is empty, click **Create on map**.
2. Click **Polygon** under "Drawing tools".
3. Click on the map at each corner of the area.
4. Press `Enter`, or right-click, to finish. The tool is put down and the new area is selected.
5. Click **Save** in the panel.
##### Change the shape of a line or an area[](#change-the-shape-of-a-line-or-an-area "Direct link to Change the shape of a line or an area")
1. With no tool in hand, click the feature on the map to select it.
2. Drag a big circle to move a corner, or a small circle (halfway along an edge) to add a corner there.
3. To move the whole feature, drag it by its body.
4. Click **Save**.
#### The drawing tools[](#the-drawing-tools "Direct link to The drawing tools")
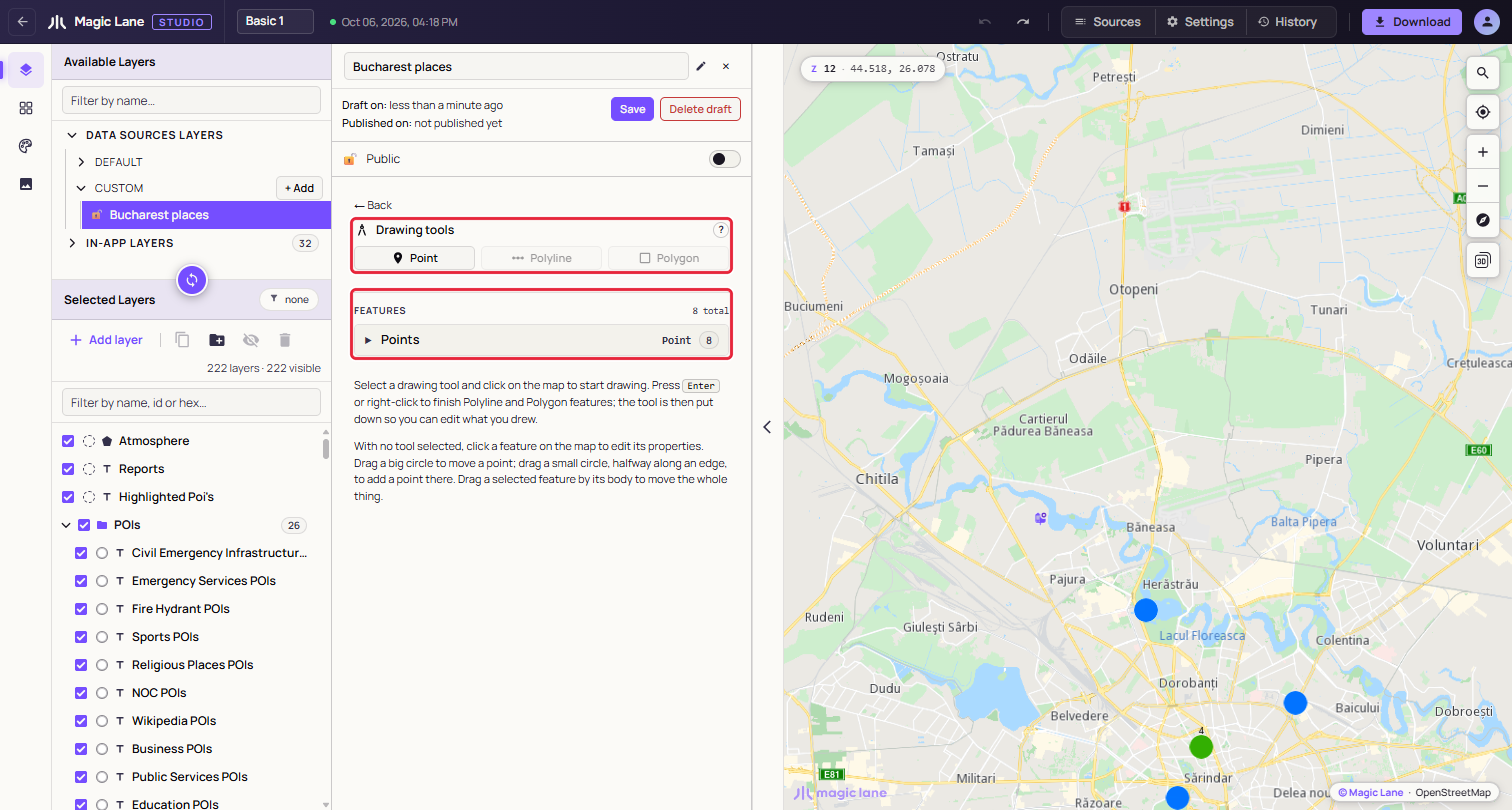
**The drawing tools. This source holds points, so Polyline and Polygon are disabled.**
Click **Point**, **Polyline** or **Polygon** to pick it up, and click it again to put it down. While a data source is selected, clicks on the map draw or edit instead of opening the layer popup.
A data source holds one kind of feature, so once it has features only that kind's tool is offered. To draw another kind, create another data source.
* **Point**: each click places a point. The tool stays in hand for the next one.
* **Polyline and Polygon**: each click adds a corner. Press `Enter` or right-click to finish. A line needs at least two corners and an area three; with fewer, the panel says so and the shape stays unfinished.
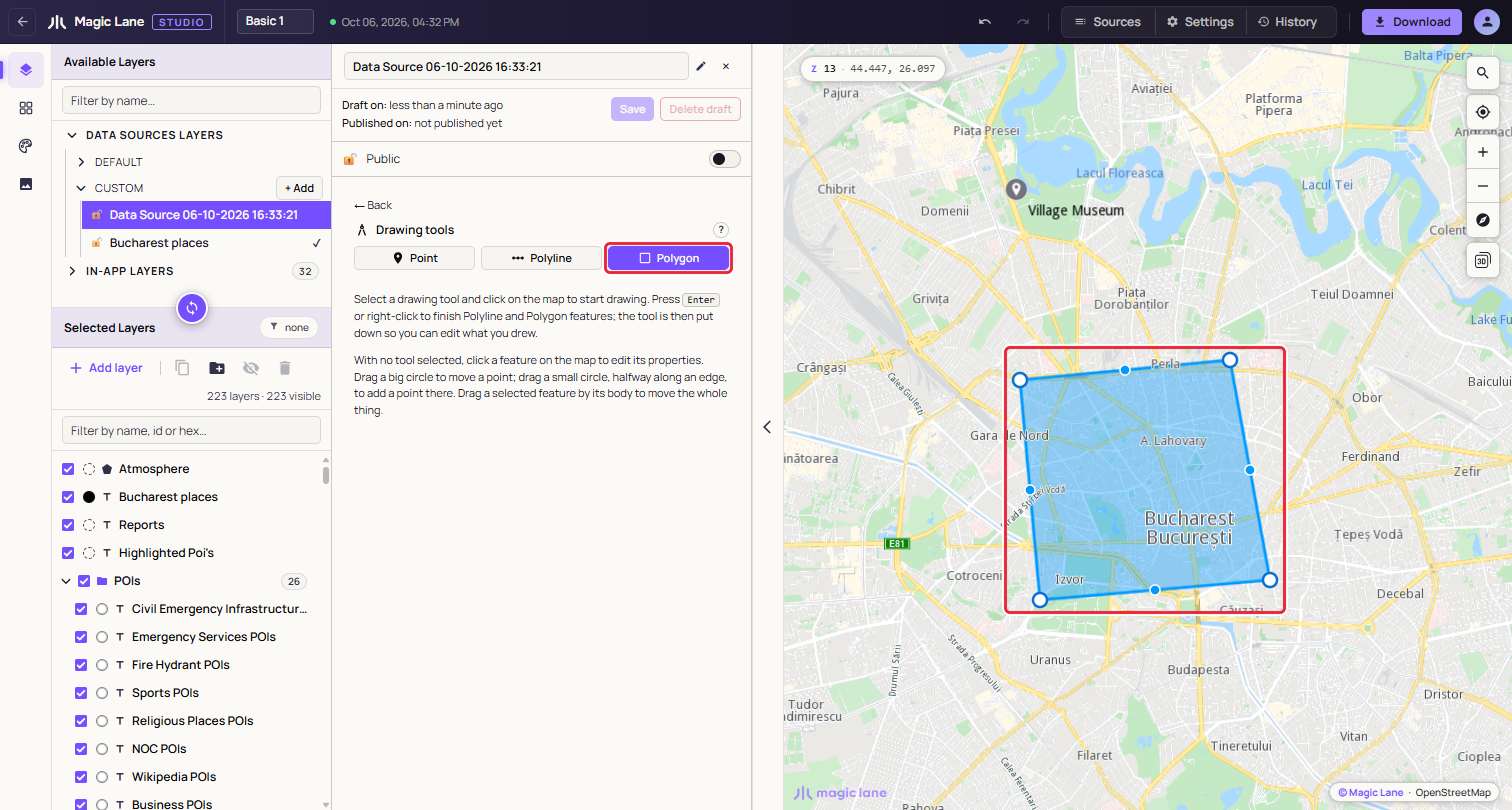
**An area in progress. You can already drag its circles before finishing.**
Finishing a line or an area puts the tool down and selects the new feature, so the next click edits it rather than starting another one.
#### Editing a feature[](#editing-a-feature "Direct link to Editing a feature")
With no tool in hand, click a feature on the map to select it; its card opens in the panel (see [Features and their properties](/docs/guides/map-studio/data/data-sources.md#features-and-their-properties)). A selected line or area shows handles:
* **Big circle, on a corner**: drag to move that corner.
* **Small circle, halfway along an edge**: drag to add a new corner where you let go. Very short edges show no small circle.
* **The feature's body**: drag to move the whole feature. This works only on a feature that is already selected; dragging an unselected one pans the map.
A point has no handles; drag the point itself.
A drag ends when you release the mouse button, even outside the map. `Esc` also ends it; the shape stays where it is. There is no undo for drawing: to put a shape back, drag it back, or click **Discard** to return to the last saved version.
#### Keys[](#keys "Direct link to Keys")
* `Enter` or right-click on the map: finish the line or area being drawn.
* `Esc`: end a drag.
* Arrow keys and `Shift+Plus` / `Shift+Minus`: pan and zoom the map while you draw, when the map has focus (see [The map, settings and history](/docs/guides/map-studio/editing/map-settings-and-history.md)).
See also: [Data sources](/docs/guides/map-studio/data/data-sources.md) · [Keyboard shortcuts](/docs/guides/map-studio/reference/keyboard-shortcuts.md)
---
### Editing a style
#### [📄️The layer list](/docs/guides/map-studio/editing/layer-tree.md)
[The Layers screen has two lists on the left. Available Layers is the catalogue of what a layer can draw; Selected Layers holds the layers of your style, in drawing order. This page covers adding layers, and selecting, ordering, grouping, hiding and deleting them.](/docs/guides/map-studio/editing/layer-tree.md)
---
### The Components screen
Last updated:
October 13, 2026
| 3 minutes read
The Components screen shows the style as the things a map is made of, such as Roads, Water and Place labels, with the layers inside each one. Use it to hide a whole part of the map, or to find a layer without knowing its name.
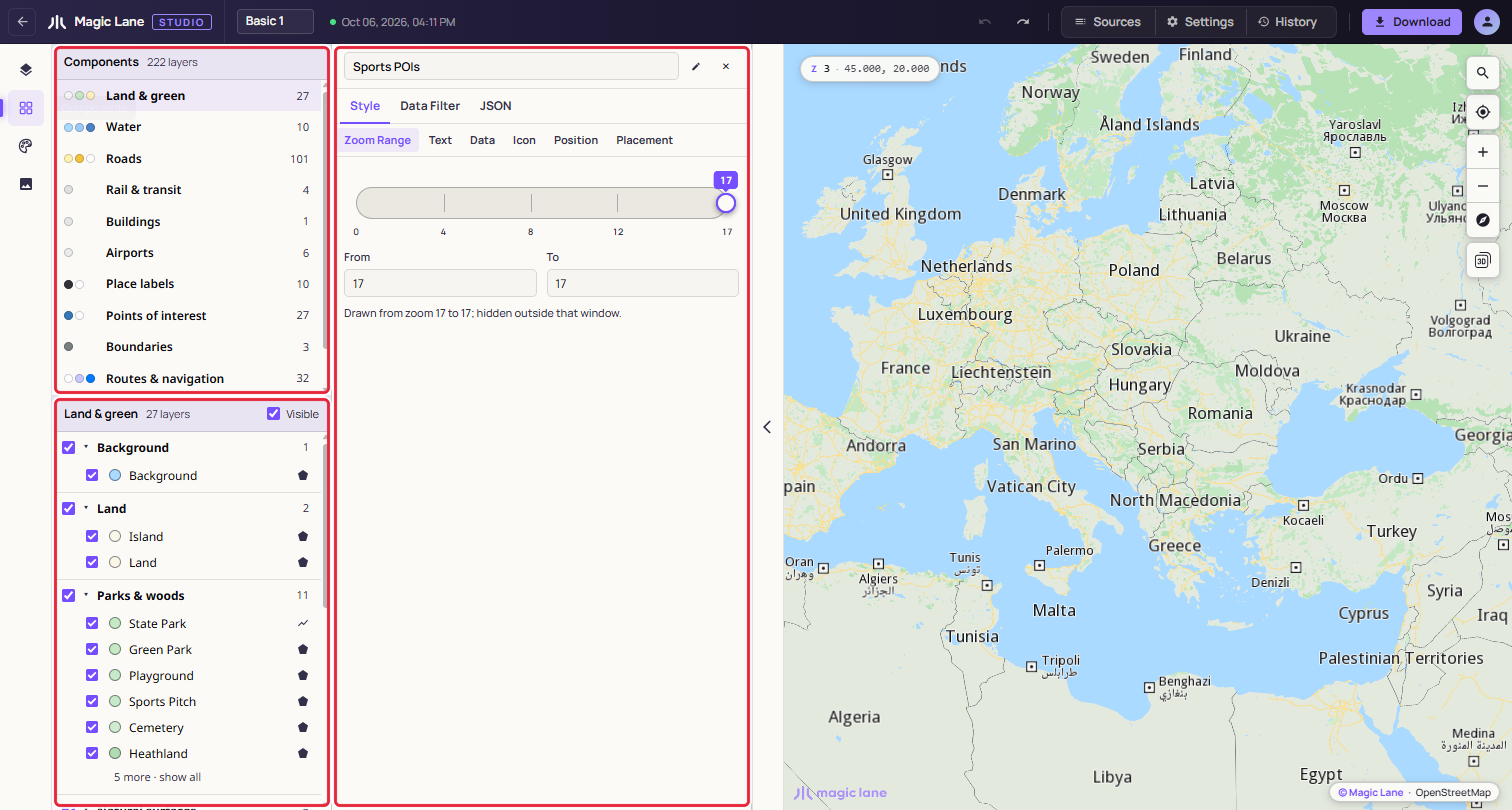
**The component list above, the open component below.**
#### Step by step[](#step-by-step "Direct link to Step by step")
##### Hide all the points of interest[](#hide-all-the-points-of-interest "Direct link to Hide all the points of interest")
1. Open **Components** on the rail.
2. Click **Points of interest** in the list.
3. Untick **Visible** in the header of the lower pane. Every point of interest disappears from the map; tick it again to bring them back.
##### Find the layer that draws motorways[](#find-the-layer-that-draws-motorways "Direct link to Find the layer that draws motorways")
1. Open **Components** and click **Roads**.
2. Under **Major roads**, click **Motorway**. Its properties open in the Properties column beside the list.
#### Components[](#components "Direct link to Components")
Studio sorts every layer of the style into a component, automatically, so every style has them. There are twelve; one with no layers in the style is left out of the list.
| Component | Groups inside it |
| ------------------- | ------------------------------------------------------------------------------------------------------------------ |
| Land & green | Background, Land, Parks & woods, Natural surfaces, Built land use, Area names |
| Water | Water, Water names, Ferry lines |
| Roads | Major roads, Secondary roads, Minor roads, Paths & tracks, Road surfaces, Road names, Road shields, One-way arrows |
| Rail & transit | Rail |
| Buildings | Buildings |
| Airports | Airports |
| Place labels | Place names |
| Points of interest | Points of interest, Overlay points |
| Boundaries | Boundaries |
| Routes & navigation | Routes, Traffic, Markers & landmarks, Drawing tools |
| Sky & atmosphere | Atmosphere |
| Custom data | Other layers |
Custom data holds every layer that fits nowhere else, so every layer appears on the screen.
#### Using the screen[](#using-the-screen "Direct link to Using the screen")
Each row in the list shows the component's main colours, its name and its number of layers, with "partly hidden ·" or "hidden ·" when some or all are hidden. Click a row to open it below.
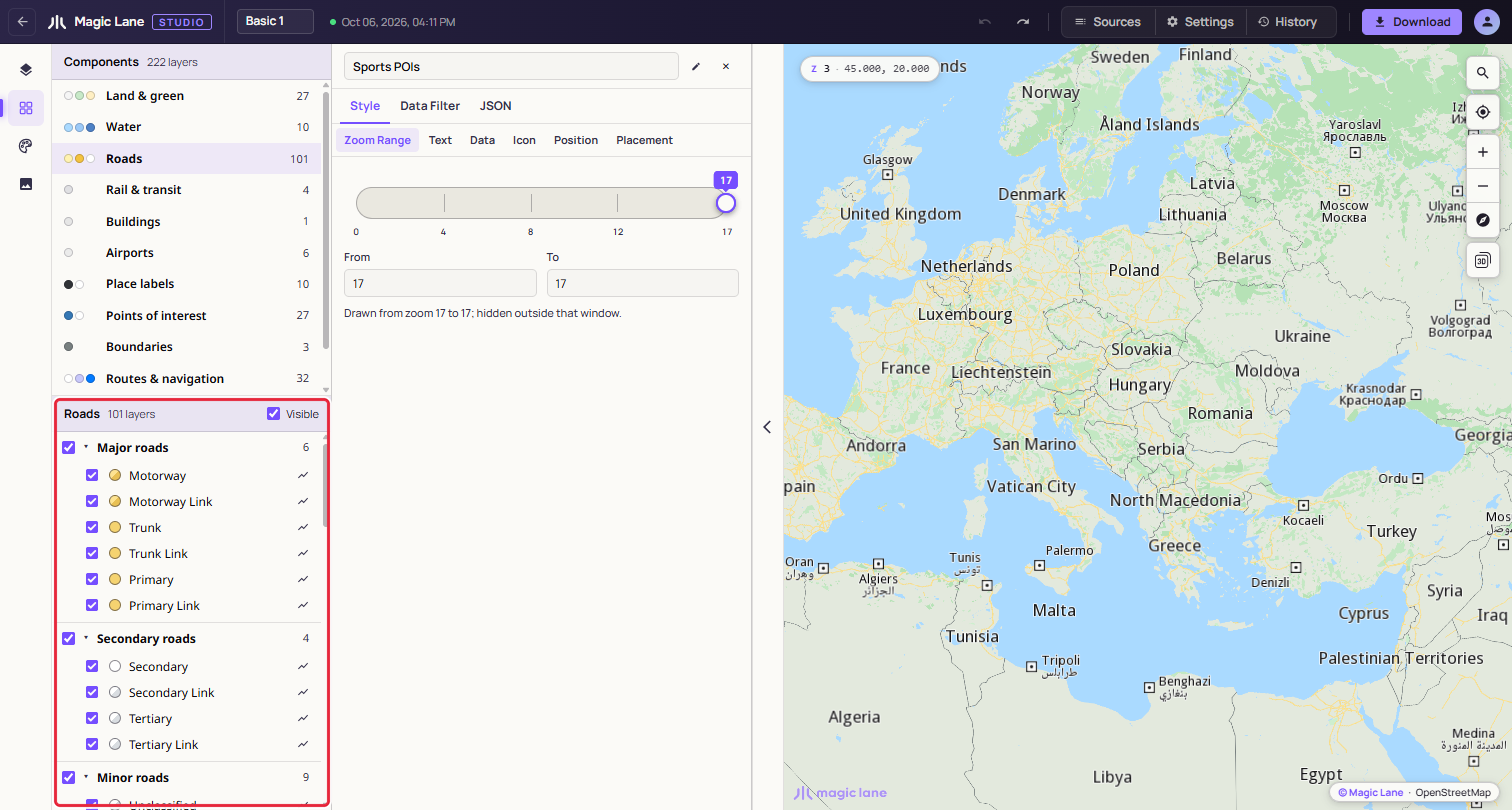
**Roads, grouped as major, secondary and minor roads, and so on.**
In the open component:
* The **Visible** checkbox in the header shows or hides the whole component.
* Each group's checkbox shows or hides that group; its caret folds it away. A long group shows six layers and a "show all" link.
* Each layer has an eye to show or hide it, a colour swatch that opens its colour in the Properties column, and its name, which opens its properties. Shift+click and Ctrl+click (⌘+click on a Mac) select several layers, to edit them together.
* Right-click a layer for **Show in Layers**, which opens the layer list with the layer selected and in view, then Hide layer, Copy Style and Paste Style (paint and zoom range), Duplicate and Delete. With several layers selected, the items say how many they act on, for example "Delete (2)". To change the drawing order or put a layer in a group, use Show in Layers and do it there.
Click the map and pick a layer from the list, and the screen opens that layer's component and group and shows the layer.
Hiding here is the same as hiding in the layer list: it is saved with the style, appears in History and can be undone. The last visible layer cannot be hidden.
See also: [The layer list](/docs/guides/map-studio/editing/layer-tree.md) · [The Properties column](/docs/guides/map-studio/editing/property-panel.md) · [Shared colours](/docs/guides/map-studio/editing/shared-colours.md)
---
### The style's font
Last updated:
October 13, 2026
| 7 minutes read
A style can carry its own font for its labels: a TTF or OTF file stored inside the style, like an image, so it goes wherever the style goes. Add it in **Settings › Typography**.
The font is one font for the whole style, in up to three faces: regular, bold and italic. Every label uses it, place names, road names, POI names and the labels of your own data, in the face its layer's **Text Style** asks for. There is no font per layer. A face the style does not have is drawn in the map's built-in font.
#### Step by step[](#step-by-step "Direct link to Step by step")
##### Give the style your own font[](#give-the-style-your-own-font "Direct link to Give the style your own font")
1. Open **Settings** in the top bar and scroll to **Typography**.
2. Drop the font's regular TTF or OTF file on the **Regular** drop zone ("Drop a TTF or OTF here, or browse…"), or click it to choose the file.
3. The labels whose Text Style is normal change to the font, and a notice confirms it: "Style font loaded — Regular face · 28 KB". A font of a few hundred KB is on the map at once; for a file over 1 MB a notice says "Loading the style font…" first, while the map engine reads it, which for a font of tens of MB takes several seconds, and the page waits with it. The slot shows the font's name, its face, its size and how many characters it has, for example "Poppins" and "Regular · 10 KB · 106 characters".
4. Labels whose Text Style is bold or italic keep the built-in bold or italic until you add the font's bold and italic files to **Bold** and **Italic** the same way.
To add a whole family at once, drop its files together on any empty slot: each file goes to the slot it names itself as, Regular, Bold or Italic. A single file goes to the slot you drop it on.
##### Go back to the built-in font[](#go-back-to-the-built-in-font "Direct link to Go back to the built-in font")
Click the × on each slot that holds a file. One `Ctrl`+`Z` brings back the last one removed.
#### The three faces[](#the-three-faces "Direct link to The three faces")
Each slot holds one face of the font, and a label uses the face its layer's **Text Style** asks for: **Regular** for normal text, **Bold** for bold, **Italic** for italic.
All three are optional, and each works on its own, so add only the faces you want. A label whose face is not in the style keeps the map's built-in font: with only a Bold face, bold labels use your font and everything else stays as it was. The Text preview in the Properties column shows which face the selected layer gets.
**Replace** puts another file in a slot; × removes it. Adding, replacing and removing a face are each one step in the history, so `Ctrl`+`Z` undoes them (see [History](/docs/guides/map-studio/editing/map-settings-and-history.md#history)).
#### Which files are accepted[](#which-files-are-accepted "Direct link to Which files are accepted")
| Accepted | Not accepted |
| ------------------------------ | ---------------------------------------------------------------------- |
| TTF and OTF files, of any size | WOFF and WOFF2 web fonts, font collections (`.ttc`), and damaged files |
There is no size limit, but size has a cost, so choose the smallest file that covers the scripts your labels need. A font for Latin, Cyrillic and Greek is usually 200 to 400 KB; one that covers Chinese, Japanese or Korean is often 10 MB or more. The file is stored in the style, so every save, every reload and every download carries it, and the map engine reads the whole file each time the font is added or the style is opened, which for a font over 1 MB happens behind a "Loading the style font…" notice and for a very large one takes several seconds. Editing the style afterwards is not slowed by the font: the engine keeps it and reads it again only when a face changes. If you need only a part of a large font, a subsetting tool can cut it down to the characters you use.
A web font is refused with "… is a WOFF2 web font; the map needs the TTF or OTF file." Use the TTF or OTF file the web font was made from; font sites usually offer it as a desktop download.
Before a file goes into the style, Studio checks that the browser can read it. A file whose letter shapes cannot be read is refused with "… is damaged: its letter shapes cannot be read, so labels would be blank on the map."
#### When the font could not be applied[](#when-the-font-could-not-be-applied "Direct link to When the font could not be applied")
If the map refuses a face the browser accepted, a notice says "The style's font was not applied" with what to do, for example "The map could not load it as a font. Try a different TTF or OTF file." The style keeps the file; the labels stay in the built-in font until you replace or remove it in **Settings › Typography**.
#### Characters the font does not have[](#characters-the-font-does-not-have "Direct link to Characters the font does not have")
A label character the font does not have is drawn in the map's built-in font. A font with only Latin letters still shows Беларусь, Ελλάδα or 東京, in the built-in font, next to the Latin names in yours. The number of characters in the slot tells you how much a font covers.
#### Licences[](#licences "Direct link to Licences")
The font file travels inside the style to every app that loads it, so check that the font's licence allows that before you add it. Fonts under the SIL Open Font License can be used this way.
Studio reads the licence text in the file. When it says the font is for personal or demo use, the slot shows "This font's licence looks limited to personal or demo use. Check that you may use it in a map you publish." The font still works; the warning stays under the slot for as long as the font is in the style.
#### A damaged font in a style[](#a-damaged-font-in-a-style "Direct link to A damaged font in a style")
A style opened from a file, or edited outside Studio, can carry a font that is damaged. Its labels are blank on the map, so Studio says so twice:
* a notice, "The style's regular font is damaged";
* under the slot, in red: "This font is damaged: its letter shapes cannot be read, so labels that use it are blank on the map. Replace it with a working copy of the file, or remove it."
Use **Replace** with a working copy of the font, or × to go back to the built-in font.
#### Where else the font shows[](#where-else-the-font-shows "Direct link to Where else the font shows")
* **The Text preview** in the Properties column draws the label in the face of the style's font that the layer uses, and names it: "Style font: Poppins — change in Settings". It reads "Style font: built-in" when the style has no font, and adds "(the style has no bold face)" when the style has a font but not the face this layer needs. **change in Settings** opens Typography. See [Text](/docs/guides/map-studio/editing/property-panel.md#text).
* **Sources** in the top bar: the summary line ends with "font (1 face)", or the number of faces.
* **Downloads**: the font is in the `.style` file and in **Style (JSON)** (see [Download and use in your app](/docs/guides/map-studio/getting-started/download-and-use.md)). In the JSON it is `fonts_section` (see [Fonts](/docs/guides/map-studio/reference/style-file-format.md#fonts)).
See also: [The image library](/docs/guides/map-studio/editing/image-library.md) · [Settings](/docs/guides/map-studio/editing/map-settings-and-history.md#settings) · [Errors and troubleshooting](/docs/guides/map-studio/reference/errors-and-troubleshooting.md#fonts)
---
### The image library
Last updated:
October 13, 2026
| 4 minutes read
The Images screen holds the pictures a style can draw: icons for points, and textures for lines and areas. Upload, find and remove them here.
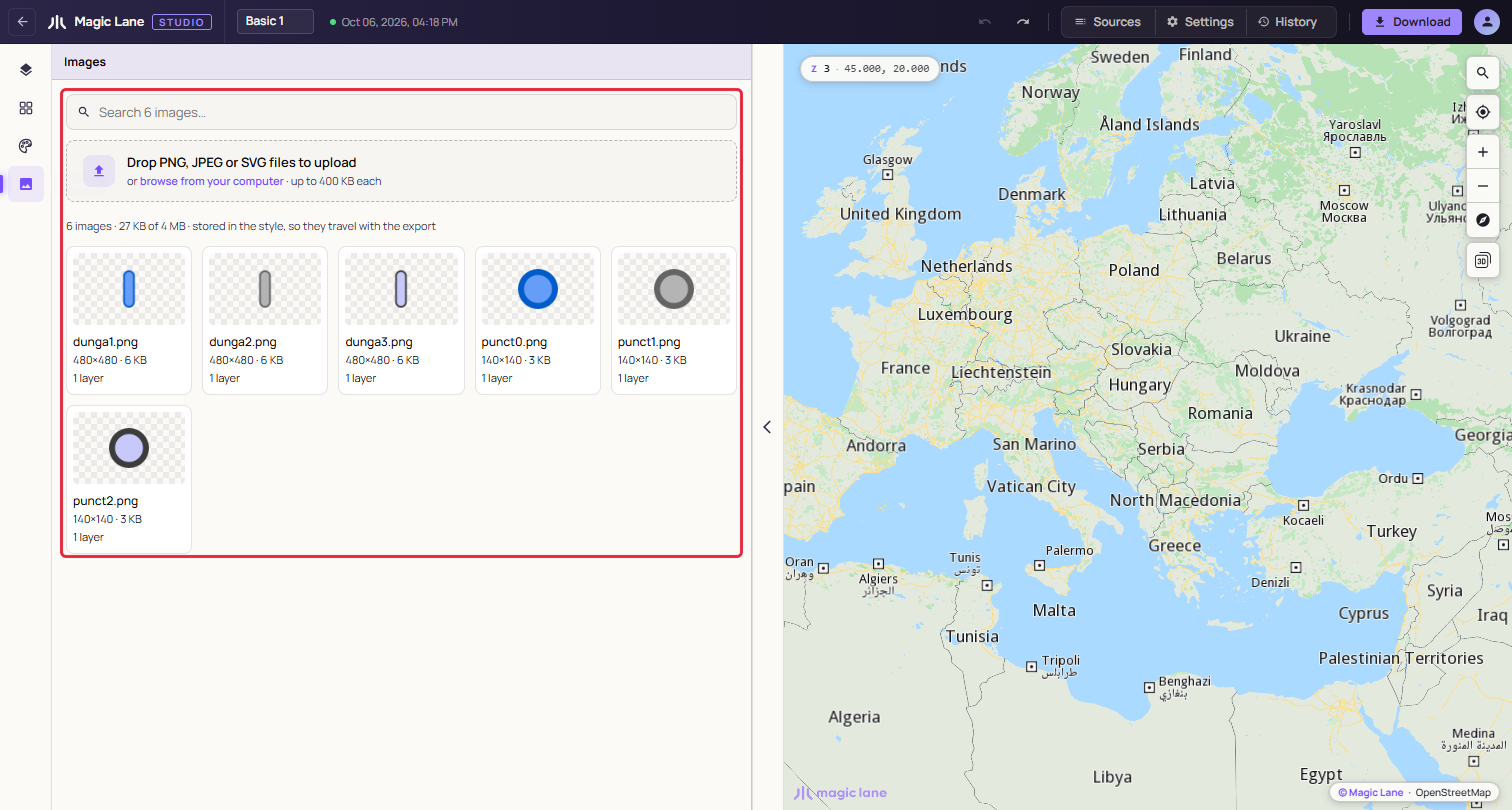
**The Images screen with the six images "Basic 1" carries.**
Open it from the **Images** button on the rail. Images are stored inside the style, so they travel with every download.
#### Step by step[](#step-by-step "Direct link to Step by step")
##### Give a point your own icon[](#give-a-point-your-own-icon "Direct link to Give a point your own icon")
1. Select a point layer, for example one built from your own data.
2. Open **Style › Icon** and select **Image**. If the editor reads "Image is not set on this layer — the map uses its default.", click **Set Image**.
3. Open the image picker and click **Upload image…**. Choose a PNG, JPEG or SVG file of up to 400 KB. It is added to the style's images and used on the layer at once.
4. To use an image the style already has, pick it from the list instead.
5. Use **Size**, beside Image, to make the icon larger or smaller.
#### Uploading[](#uploading "Direct link to Uploading")
Drop files on the dropzone, or click it to browse. Several files can go in at once, and one Ctrl+Z (⌘Z on a Mac) takes them all back.
| Limit | Value |
| ----------------------- | -------------- |
| Formats | PNG, JPEG, SVG |
| Each image | up to 400 KB |
| All images in one style | up to 4 MB |
The counts line starts with how much room is left, for example "6 images · 27 KB of 4 MB". A file over a limit is refused and the counts line says why; the other files still go in. A file with the same name as an image already in the style is added as `museum(1).png`, so no layer changes by surprise.
**Choosing images:** use a PNG with a transparent background, or an SVG, at about the size the icon will be drawn. The card shows the image on a checkerboard, so you can see whether its background is transparent.
#### Finding and checking images[](#finding-and-checking-images "Direct link to Finding and checking images")
"Search 6 images…" filters the cards by name. Each card shows the image, its name, its pixel size and weight, such as "480×480 · 6 KB", and how many layers use it, or "Unused".
Click a card, or its layer count, to see which layers use the image. A line above the cards reads, for example, "museum.png is used by 2 layers:" with a chip for each layer, or "museum.png is not used by any layer." Click a chip to open that layer in the layer list. Click the card again, or the ×, to close the line.
Click the map and pick a layer from the list, and the screen marks the images that layer uses, for example "Bucharest places uses museum.png."
#### Using an image in a layer[](#using-an-image-in-a-layer "Direct link to Using an image in a layer")
In the Properties column, **Style › Icon › Image** picks one of the style's images or "No icon". Under the list, **Upload image…** adds a file and uses it at once, and **Manage images** opens this screen with a **Use for this stop** button on every card. On a line or an area, an image fills the layer as a texture, blended with the layer's colours. Points of interest on the base map draw their category's icon; an image set there replaces it.
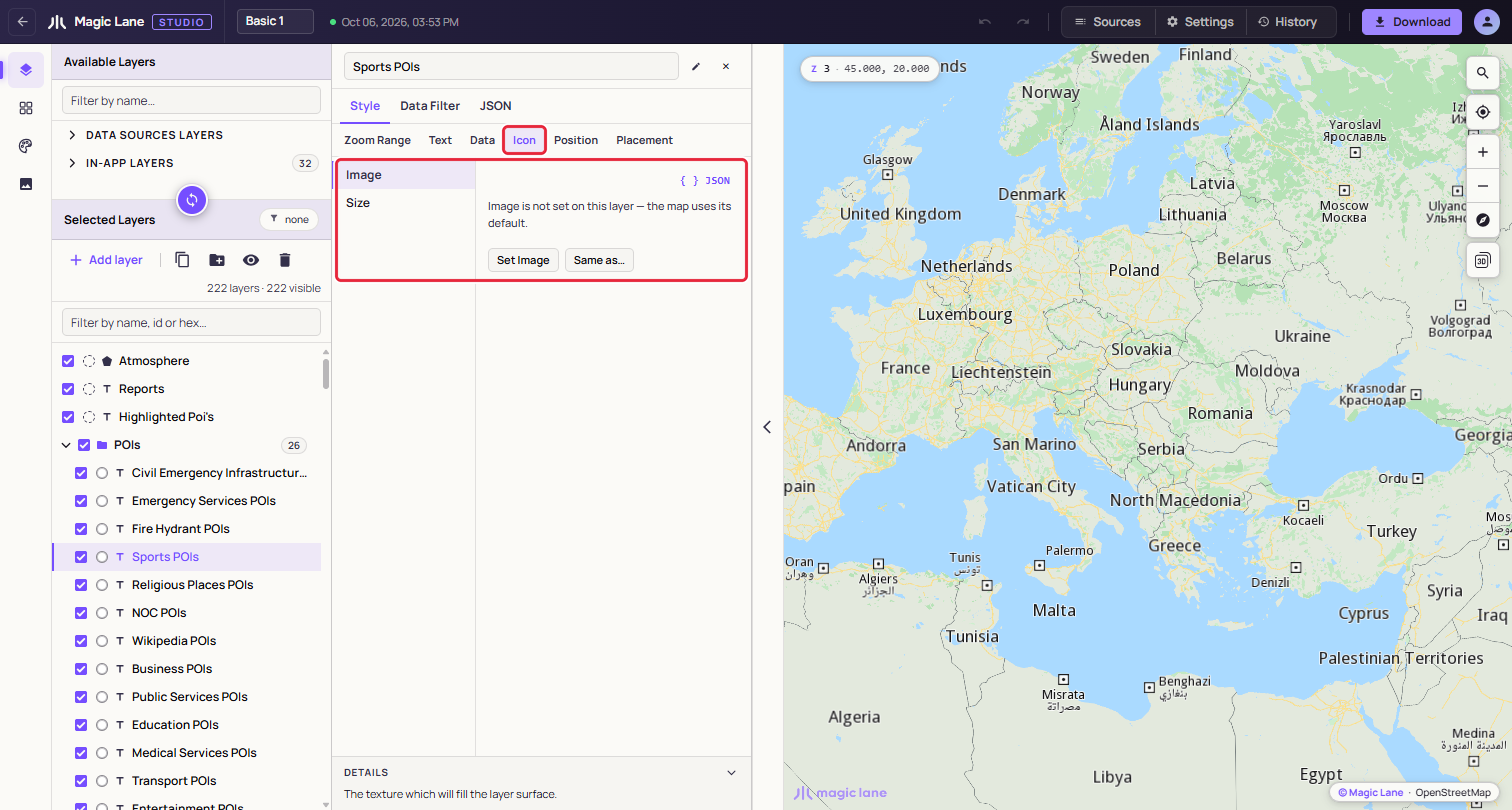
**Image on a symbol layer before it is set.**
#### Removing an image[](#removing-an-image "Direct link to Removing an image")
Click the × on a card. An unused image goes at once. An image in use asks first and names the layers that use it, for example "One layer uses it, and will be set to No icon until you pick another: Bucharest places." Undo brings the image back, with the layers drawing it again.
An image name the style does not hold shows "Missing image" in the layer's Image picker; pick another image, or No icon.
See also: [The Properties column](/docs/guides/map-studio/editing/property-panel.md) · [Download](/docs/guides/map-studio/getting-started/download-and-use.md) · [History](/docs/guides/map-studio/editing/map-settings-and-history.md#history)
---
### The layer list
Last updated:
October 13, 2026
| 9 minutes read
The Layers screen has two lists on the left. Available Layers is the catalogue of what a layer can draw; Selected Layers holds the layers of your style, in drawing order. This page covers adding layers, and selecting, ordering, grouping, hiding and deleting them.
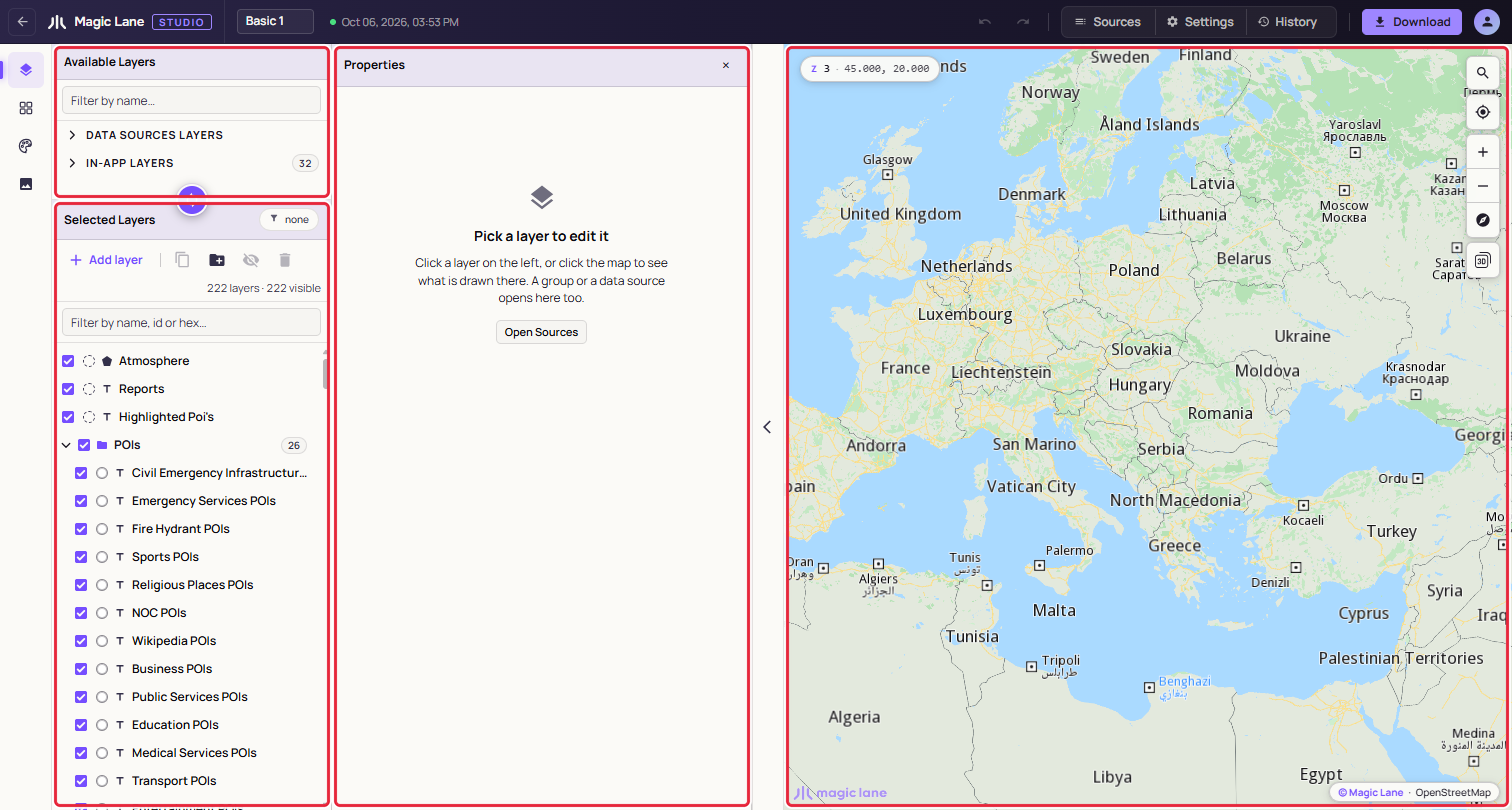
**Available Layers above, Selected Layers below, the Properties column and the map.**
#### Step by step[](#step-by-step "Direct link to Step by step")
##### Add a layer[](#add-a-layer "Direct link to Add a layer")
1. Click **Add layer** in the Selected Layers toolbar, or press N.
2. Type part of a name, such as `motorway`, or paste a data source id.
3. Press Enter or click a row. The layer is added above the selected layer, in its group, and is selected.
You can also drag any row from Available Layers into Selected Layers.
##### Put layers in a group[](#put-layers-in-a-group "Direct link to Put layers in a group")
1. Select the layers: click one, then Shift+click another to select the run between them, or Ctrl+click (⌘+click on a Mac) to add single layers.
2. Press G, or click **Add group** in the toolbar. The layers go into a new group named "New Group".
3. Double-click the group name, type a name and press Enter.
#### Available Layers[](#available-layers "Direct link to Available Layers")
Every layer draws from data, and the data is chosen when the layer is created:
* **Data Sources Layers › DEFAULT**: the map data Magic Lane serves, in groups such as Roads, Labels and Areas. Open a group to see its sources.
* **Data Sources Layers › CUSTOM**: your own data, uploaded or drawn. **+ Add** creates a data source (see [Data sources](/docs/guides/map-studio/data/data-sources.md)); it can be added to the style once it is tiled, marked ✔.
* **In-App Layers**: templates for what an app draws on the map at run time, such as routes, traffic, drawings, markers and reports.
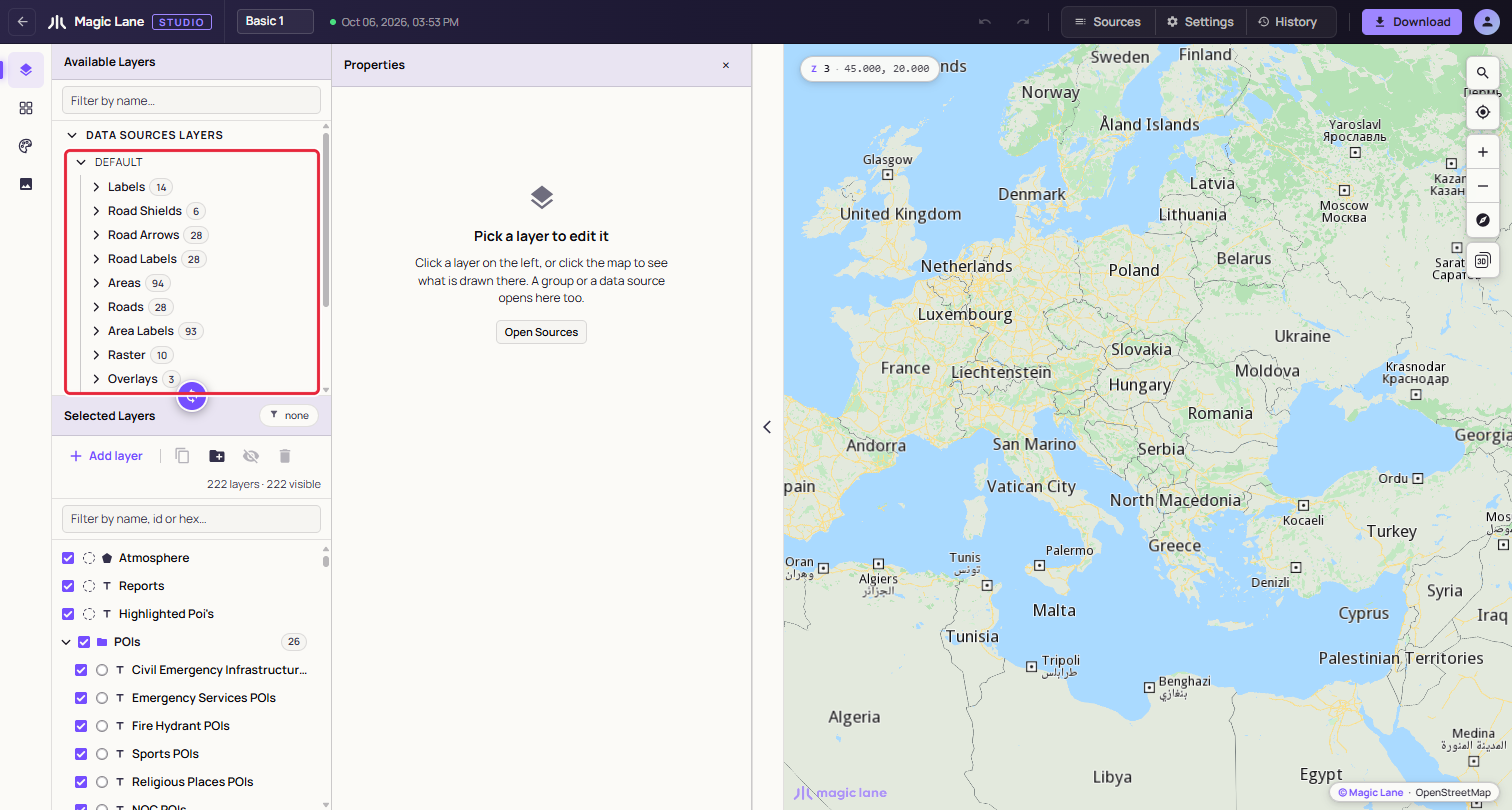
**DEFAULT: the map data Magic Lane serves, grouped, with a count on each group.**
The "Filter by name…" box searches all three. When the selected layer draws from a source, that source's row is marked "IN USE".
The Add layer picker lists the same things, under "Data sources", "In-app layers" and "Your data". Use ↑ and ↓ and Enter, or click; Esc closes it. Its footer says where a pick lands, for example "340 layers · adds above the selected one, in its group".
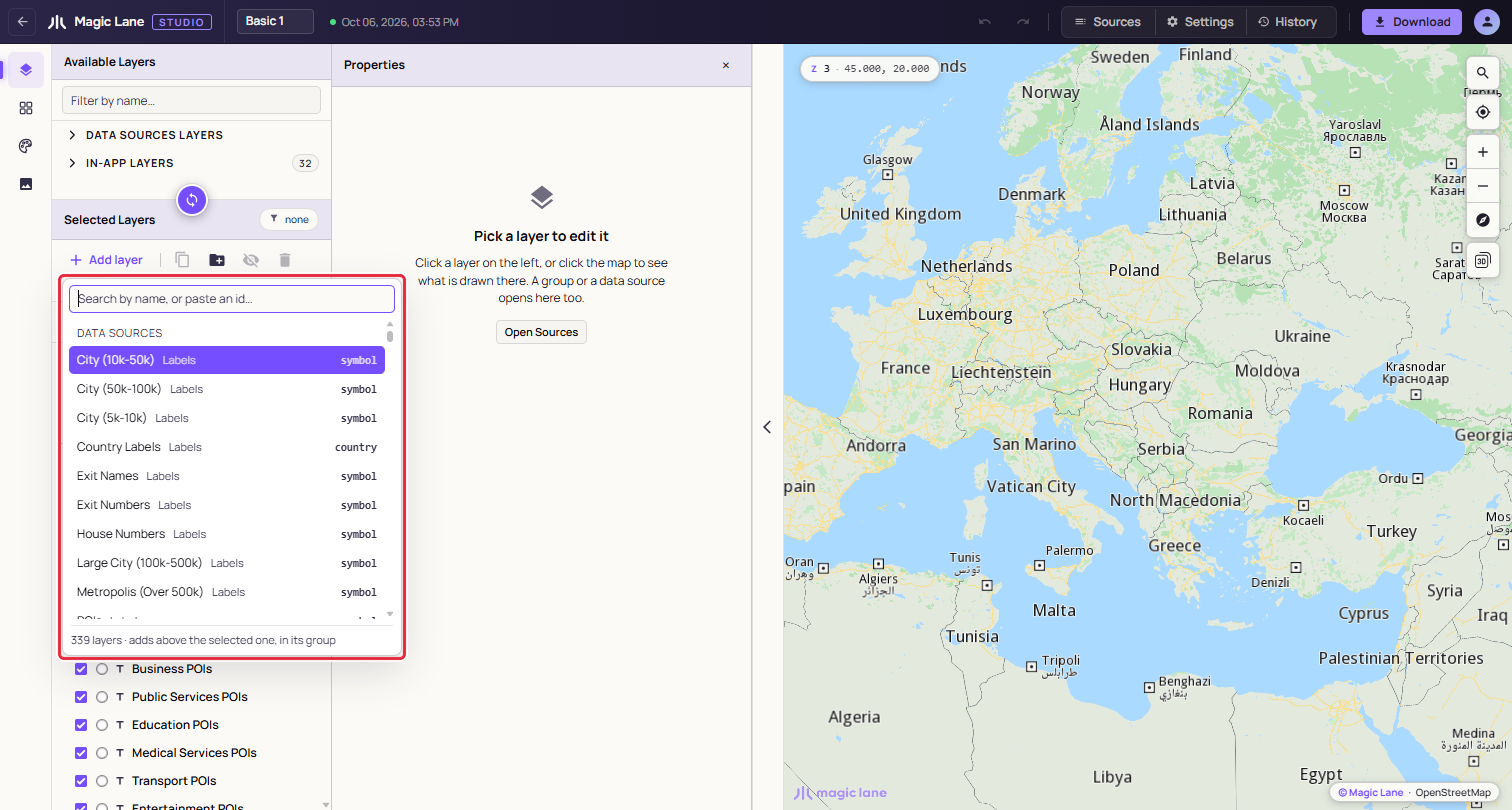
**The picker: search by name or paste an id.**
When you drag a row in, where you let go decides where the layer lands: on a layer, above it and in its group; on a group header, at the top of that group; on the "Drop here" band above or below the list, on top of or under every layer (see [Reordering](#reordering)).
A layer over your own data takes its type from the data (see [Adding it to the style](/docs/guides/map-studio/data/data-sources.md#adding-it-to-the-style)). A new layer starts with simple black paint for you to style.
##### In-App Layers[](#in-app-layers "Direct link to In-App Layers")
In-App Layers are templates for what an app draws on the map while it runs: routes, the part of a route already travelled, traffic, turn arrows, markers, and the points, paths and areas an app lets its users draw. Drag one in to decide how your app draws those things in this style. Every In-App Layer type is listed in the [Layer types reference](/docs/guides/map-studio/reference/layer-types-reference.md).
The map has no routes of its own, so a route layer draws nothing where you are. Studio offers a sample instead, and moves the map only when you ask:
1. Select one route layer. A pill over the map says, for example, "Primary Route is drawn on a calculated route, and there is none here."
2. Click **Show sample route in Washington, DC**. The map moves there and draws a sample route in the layer's paint. If no route can be calculated there, the sample is in Amsterdam, and the pill says so.
3. The pill now reads "Sample route · Washington, DC". While it is up, selecting another route layer shows that layer's sample at once.
4. Click **Back to where you were** to return the map to where it was, with the same perspective. The × hides the pill.
For a travelled-route layer, the pill adds "Press Simulate to draw the travelled part." **Simulate**, at the right of the map, drives along the sample route at five times normal speed, so the travelled part appears in the layer's paint; the map stays where you put it, and **Stop** ends the drive. Public transport routes cannot be simulated, so their travelled part is not drawn.
Highlighted Landmarks (Highlighted POI Pin in In-App Layers) works the same way with a highlighted search result: "… is drawn on a highlighted search result, and there is none here.", **Show sample in New York**, then "Sample highlight · New York". If the map is already zoomed in on the sample's place, the sample is shown without asking. Route labels have no sample.
For the in-app drawing layers, the Properties column shows a sample shape in the layer's paint.
#### Selected Layers[](#selected-layers "Direct link to Selected Layers")
Each row has a visibility checkbox, a colour chip, a type icon and the name. Hover the name for the layer's type and zoom range, for example `Motorway · Line · z3-17`. Click the colour chip to open that colour in the Properties column. A layer higher in the list is drawn over the layers below it.
The counts line under the toolbar reads "222 layers · 222 visible". With a filter on it reads "8 of 222 layers · 222 visible", and with several layers selected, "2 selected".
##### Selecting[](#selecting "Direct link to Selecting")
Click a layer to select it. Shift+click selects the run between two layers; Ctrl+click (⌘+click on a Mac) adds or removes one. With several layers selected, a paint edit reaches all of them; see [Editing several layers](/docs/guides/map-studio/editing/property-panel.md#editing-several-layers).
Click a group header to open the group panel: its name, **Hide group**, the number of layers, and a **By type** list. Click a type there, such as "symbol 26", to select every layer of that type in the group.
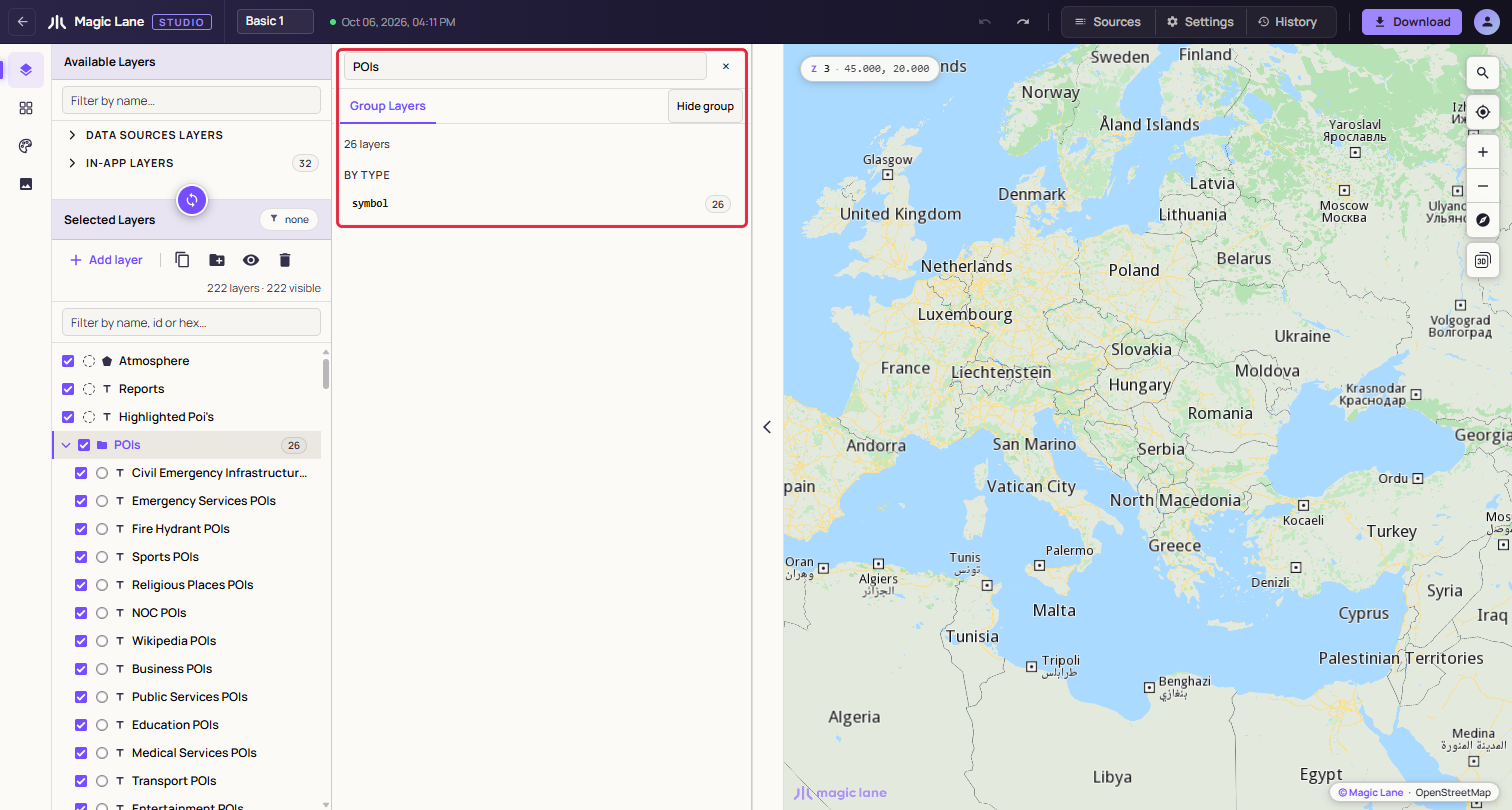
**A group's panel. The By type list selects every layer of one type.**
##### Reordering[](#reordering "Direct link to Reordering")
Drag a row; Esc drops it back where it was. Where you let go decides the result:
* on the top or bottom edge of a layer: before or after it, in its group;
* on the middle of a layer: both layers go into a new group;
* on the upper part of a group header: above the group; on the lower part: inside it, at the top;
* on "↑ Drop here to put it on top", which takes the place of the filter box while you drag, or on "↓ Drop here to put it at the bottom", under the list: on top of or under every layer, outside every group. The label changes to "Let go to put it on top" (or "at the bottom") when the pointer is over it.
Hold the dragged row near the top or bottom edge of the list and the list scrolls by itself, so you can drop a layer at a place that was off screen. A layer you add is scrolled into view and briefly highlighted; if a filter would hide it, the filter is cleared.
With the keyboard, Ctrl+↑ and Ctrl+↓ move the selected layer one row; at the edge of a group they move it out of the group, or into the group that starts next. Ctrl+Alt+↑ and Ctrl+Alt+↓ move it to the front or the back (⌘ and ⌥ on a Mac). Clear the filter before you drag: the filtered list is flat, and the "put it on top" target is not offered.
##### Groups[](#groups "Direct link to Groups")
With nothing selected, G or **Add group** adds an empty group at the top. F2 also renames the selected group. Right-click a group for Hide group, Rename group, Duplicate group & content, Delete group, which keeps the layers, and Delete group & content, which asks first. The caret folds a group away. Groups organise the list; they do not change how the map is drawn.
##### Hiding and showing[](#hiding-and-showing "Direct link to Hiding and showing")
The checkbox hides or shows a layer; a hidden layer is greyed, with a crossed eye at the end of its row. A group's checkbox hides or shows everything in it. V hides the selected layers, or shows them when they are all hidden. The last visible layer cannot be hidden. Hiding is saved with the style and can be undone.
##### Filtering the list[](#filtering-the-list "Direct link to Filtering the list")
Type in "Filter by name, id or hex…" to narrow the list. It matches layer names, a hex colour such as `#c5c9d9` (every layer that uses it: in Basic 1, the 29 one-way arrow layers), and a data source number such as `12`. The chip at the top right, "none" or "1 filter", opens the Filters card, where you can filter by shape and by layer type. Esc or the × clears the box.
##### Layers with problems[](#layers-with-problems "Direct link to Layers with problems")
A layer with a problem has a short label at the end of its row: "Source deleted" when its data source was deleted, or a label such as "No type" or "Zoom unreadable" when the style came with a part Studio could not read. Hover the label for the full explanation. When there are such layers, a ⚠ chip with their number follows the layer count, such as "⚠ 3": click it to show only those layers, and click it again to show every layer. What each label means is listed in [A style with damaged parts](/docs/guides/map-studio/reference/errors-and-troubleshooting.md#a-style-with-damaged-parts).
##### Toolbar and right-click menu[](#toolbar-and-right-click-menu "Direct link to Toolbar and right-click menu")
| Toolbar button | Shortcut | What it does |
| -------------- | ----------------------------- | ----------------------------------------------------------------- |
| Add layer | N | Opens the picker. |
| Duplicate | D | Copies the selected layers, or a selected group with its content. |
| Add group | G | Puts the selected layers in a new group. |
| Hide / Show | V | Hides or shows the selection. |
| Delete | Ctrl+Backspace or Ctrl+Delete | Deletes the selected layers, or asks before deleting a group. |
Right-click a layer for Zoom to data (for your own data; double-clicking the row does the same), Hide layer, Copy Style and Paste Style (paint and zoom range), Group, Remove from group, Move up, Move down, Move to front, Move to back, Duplicate and Delete. With several layers selected, the items say how many they act on, for example "Delete (2)".
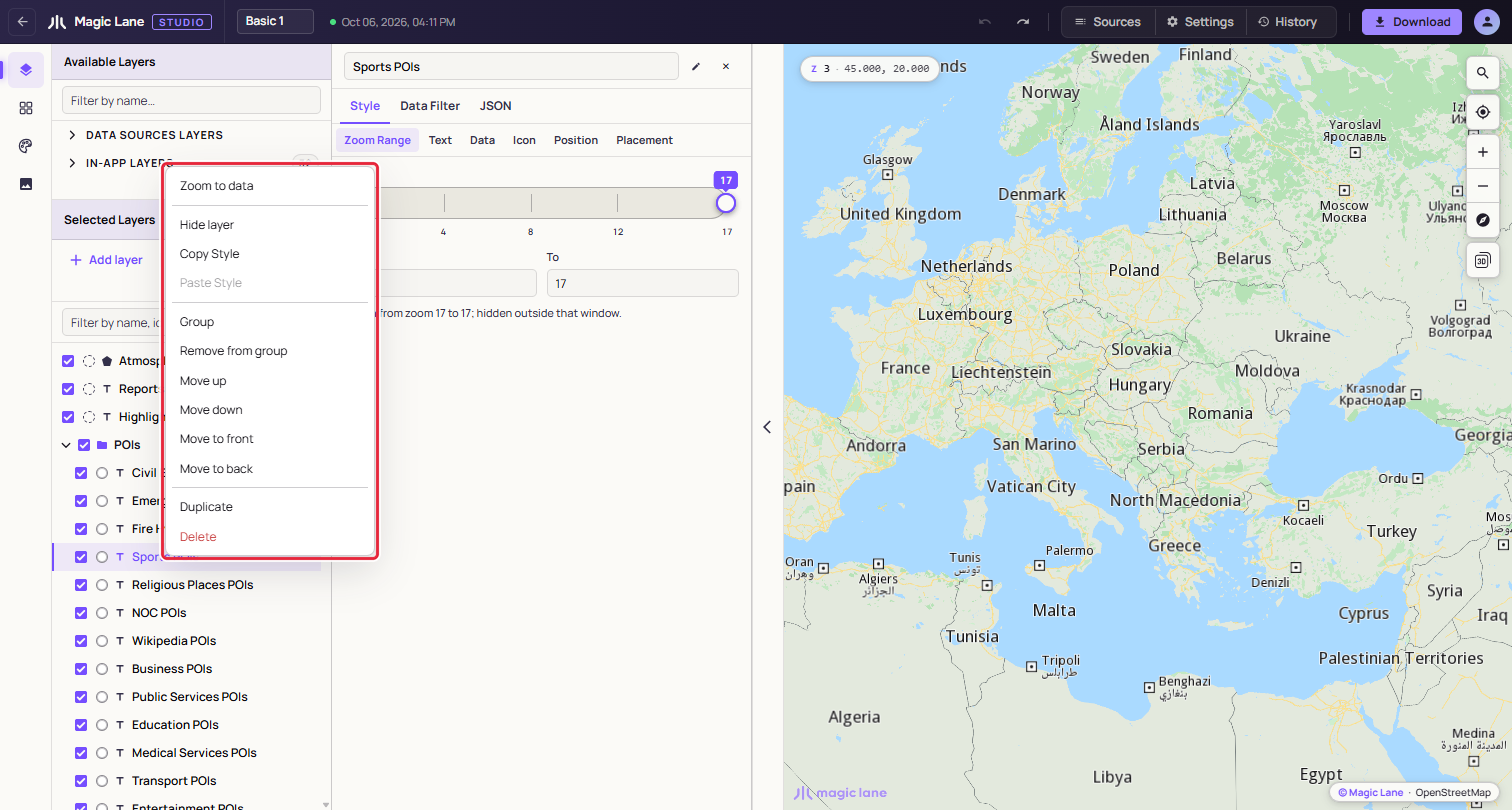
**The right-click menu on a layer.**
A style keeps at least one layer. Every add, move, hide and delete is one undo step.
See also: [The Properties column](/docs/guides/map-studio/editing/property-panel.md) · [Data sources](/docs/guides/map-studio/data/data-sources.md) · [Keyboard shortcuts](/docs/guides/map-studio/reference/keyboard-shortcuts.md)
---
### The map, settings and history
Last updated:
October 13, 2026
| 9 minutes read
The map on the right of the editor shows your style as you edit it. This page covers moving around it, finding out which layer drew something, the Settings drawer, and undoing changes with History.
#### Step by step[](#step-by-step "Direct link to Step by step")
##### Find the layer that draws something[](#find-the-layer-that-draws-something "Direct link to Find the layer that draws something")
1. Click the thing on the map, such as a road or a label. A popup headed LAYERS lists every layer that drew at that point, topmost first.
2. Click a row. The layer opens in the Properties column, on the screen you are on.
##### Set where the style opens[](#set-where-the-style-opens "Direct link to Set where the style opens")
1. Move the map to the view the style should open at.
2. Open **Settings** in the top bar and click **Use current view** under **Default map position**.
3. Under **Lock default position**, keep **URL wins** so that shared links open where they were copied, or choose **Always open here**.
##### Go back to how the style looked earlier[](#go-back-to-how-the-style-looked-earlier "Direct link to Go back to how the style looked earlier")
1. Open **History** in the top bar.
2. Click the row of the last change you want to keep. Every change above it is undone. To undo everything from this session, click the bottom row, "Opened \