# Put your own data on the map
Last updated:
October 13, 2026
\| 4 minutes read
In this tutorial you upload a file of places, add it to a style as a layer, label each place with its name, and show only one category.
**Time:** about 15 minutes.
## Before you start[](#before-you-start "Direct link to Before you start")
* A style open in Studio. If this is your first time, start with [Your first style in 10 minutes](/docs/guides/map-studio/tutorials/first-style.md).
* The sample file [bucharest-places.geojson](/docs/samples/map-studio/bucharest-places.geojson): eight places in Bucharest, each with a `name`, a `category`, a `rating` and a `wheelchair` flag. Open the link and save the file (Ctrl+S, ⌘S on a Mac).
* Prefer a spreadsheet? [bucharest-charging-stations.csv](/docs/samples/map-studio/bucharest-charging-stations.csv) holds eight charging stations with `lat` and `lon` columns, and works the same way.
## 1. Create a data source[](#1-create-a-data-source "Direct link to 1. Create a data source")
1. On the Layers screen, open **Available Layers › Data Sources Layers**.
2. Click **+ Add** on the CUSTOM row. A new data source opens in the Properties column.
3. Click the name field and type `Bucharest places`.
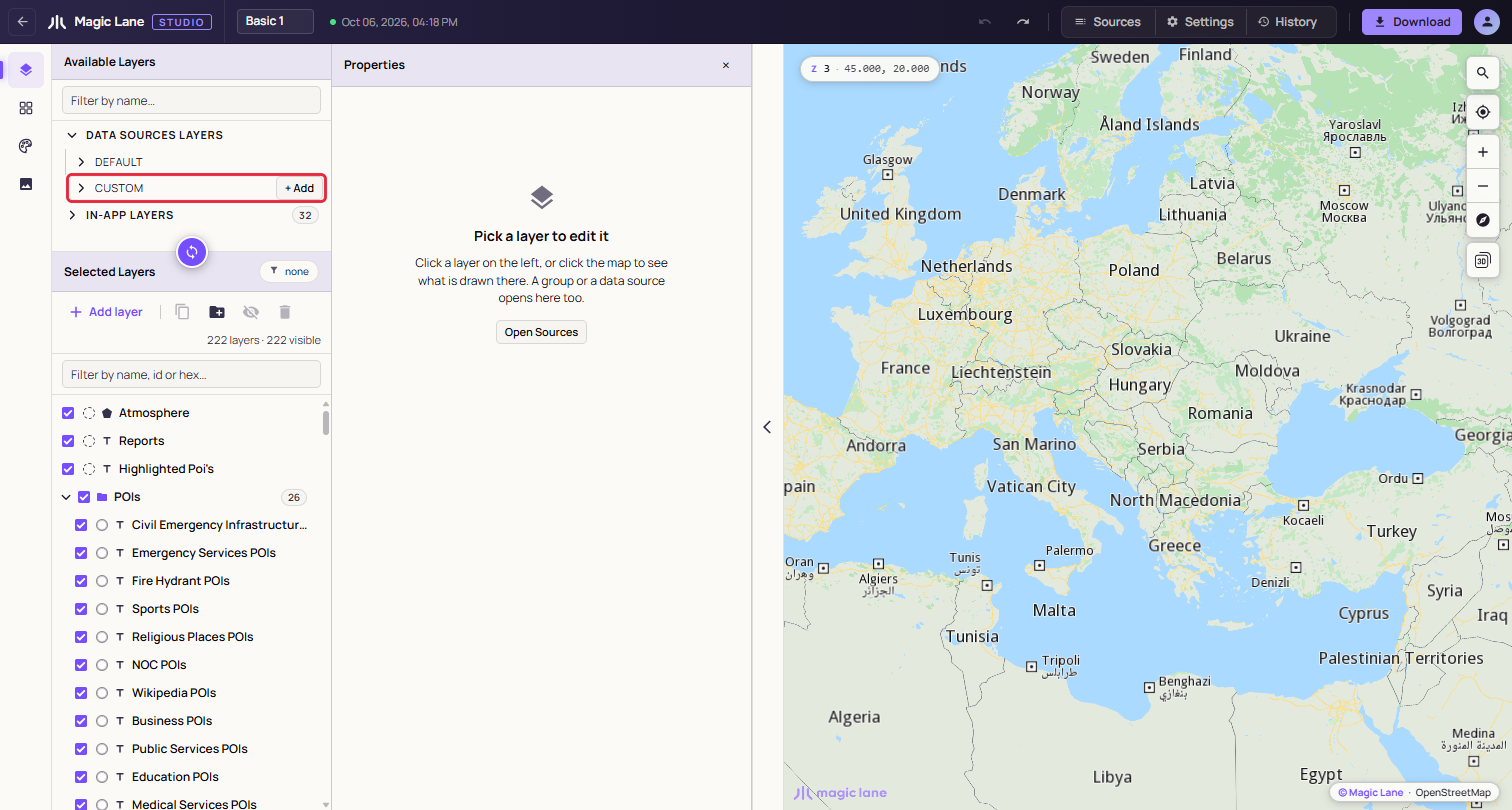
**Your own data sources live under CUSTOM.**
## 2. Upload the file[](#2-upload-the-file "Direct link to 2. Upload the file")
1. Click **Upload a data file**.
2. Drop `bucharest-places.geojson` on the dropzone, or click it and pick the file.
3. The panel says "GeoJSON file successfully parsed (8 features)." Click **Append** to put them in the data source.
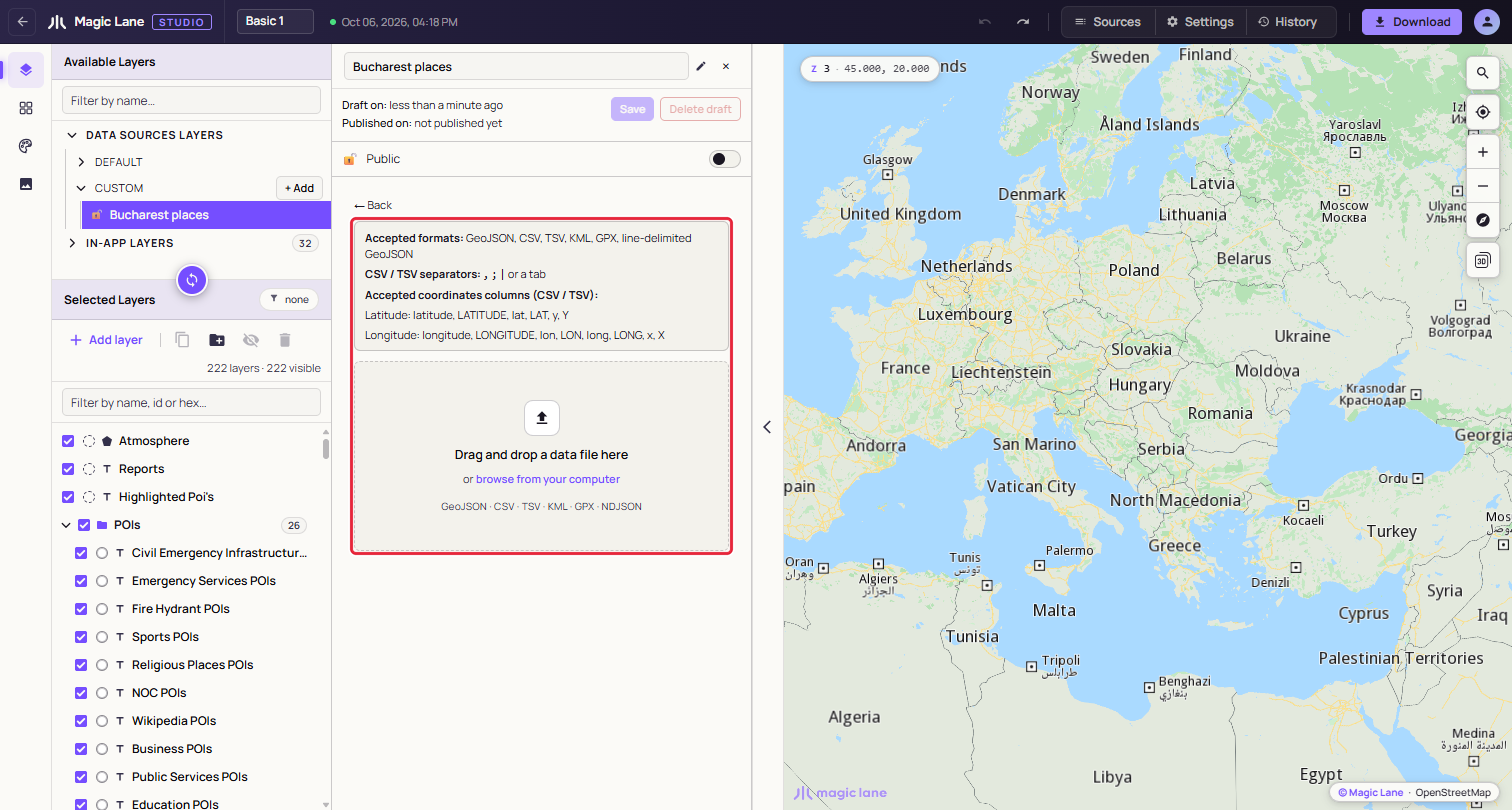
**Drop the file anywhere in the dashed area.**
Studio reads GeoJSON, CSV, TSV, KML, GPX and line-delimited GeoJSON. See [Data sources](/docs/guides/map-studio/data/data-sources.md).
## 3. Save it[](#3-save-it "Direct link to 3. Save it")
1. Click **Save**. The status line shows "◌ Tiling…" while the server prepares your data.
2. After a short wait it reads "✔ Tiled — drag it into Selected Layers to use it.", and a notice says the source is ready.
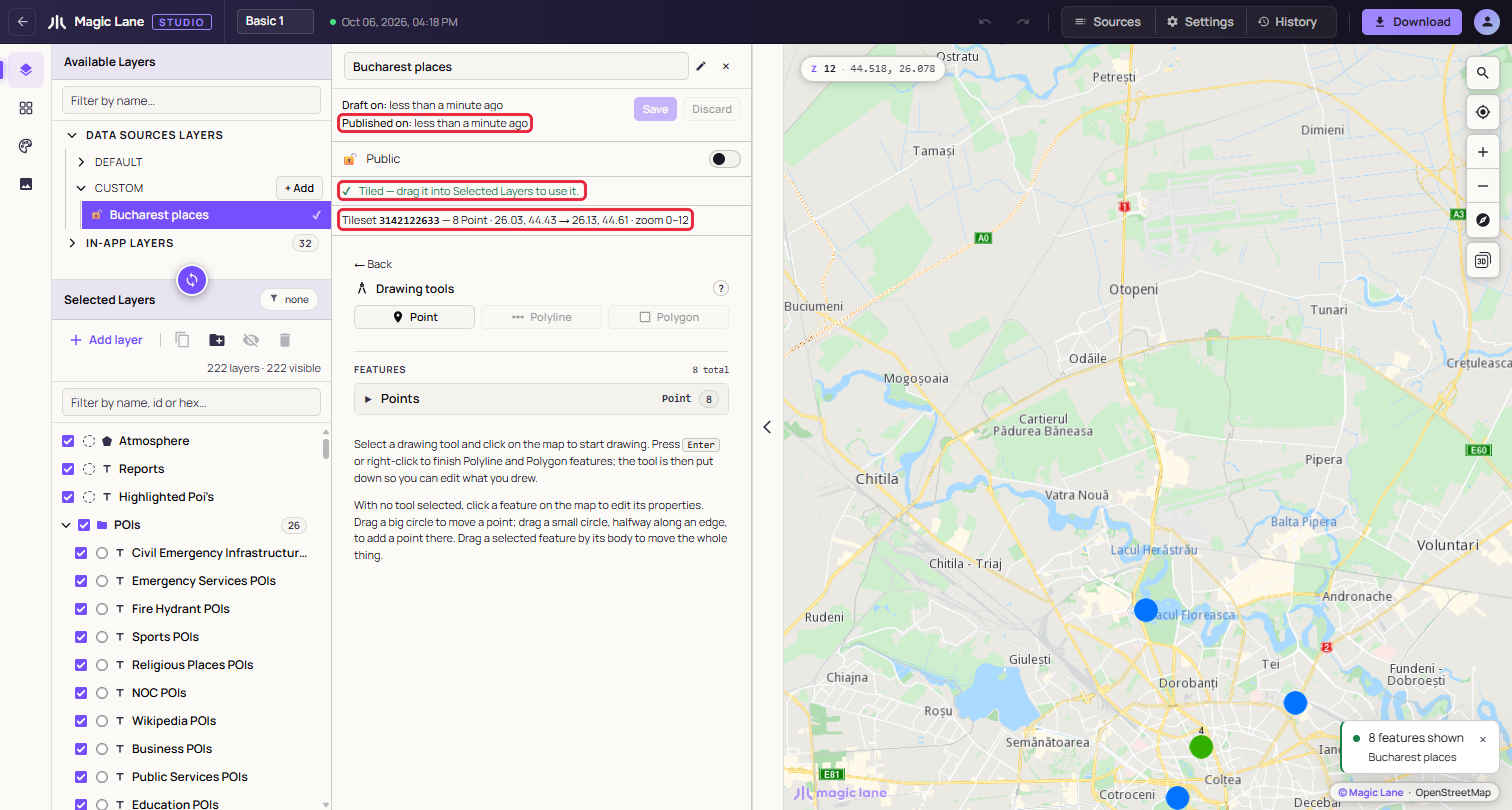
**Studio tells you when your data is ready.**
## 4. Add it to the style[](#4-add-it-to-the-style "Direct link to 4. Add it to the style")
1. Drag the **Bucharest places** row from CUSTOM into Selected Layers, near the top of the list so the places are drawn above the roads.
2. A layer named after the source is added and selected, and the map moves to Bucharest. Each place is drawn with the map's default marker.
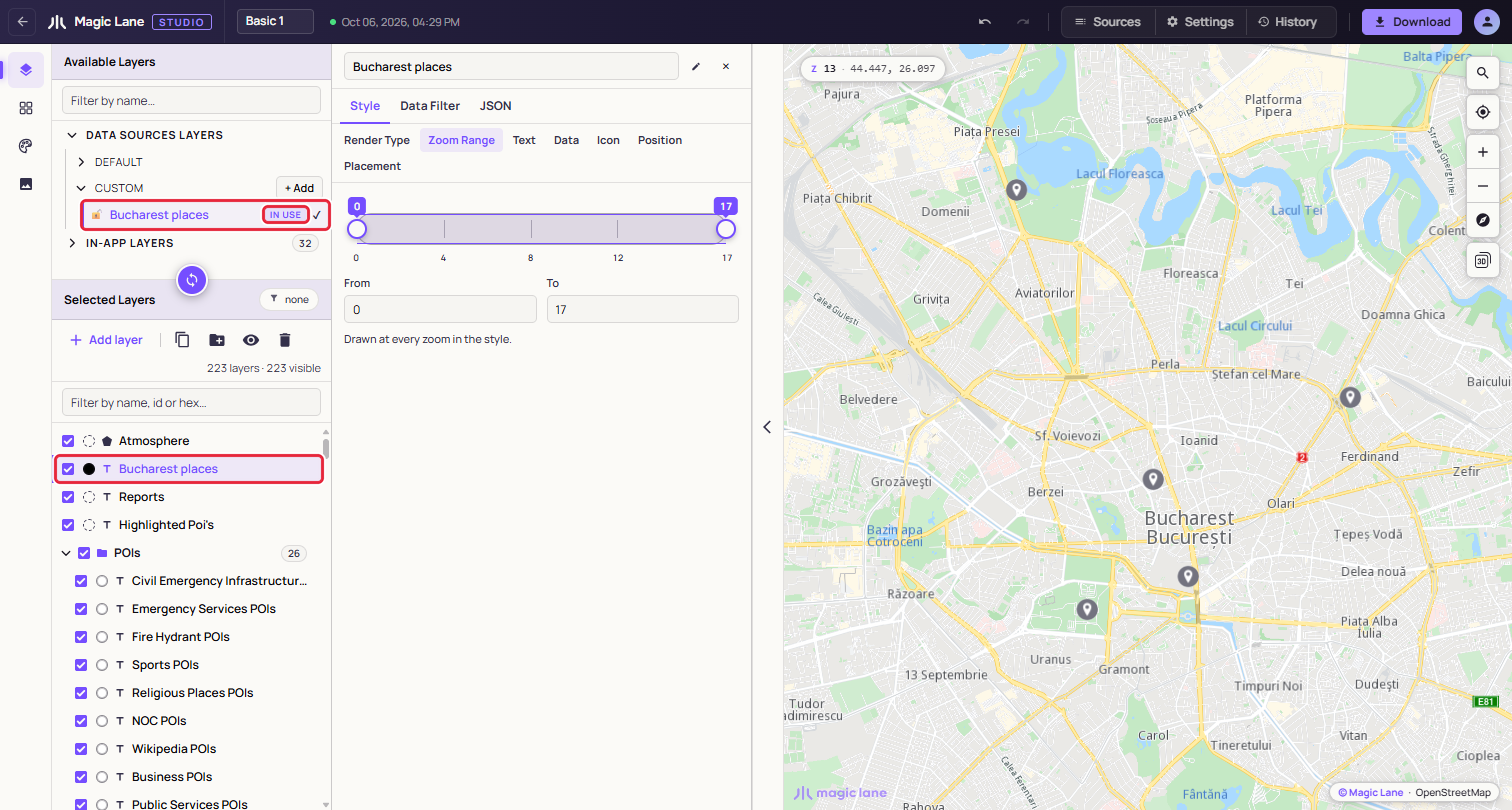
**The new layer is selected, ready to style.**
## 5. Label each place with its name[](#5-label-each-place-with-its-name "Direct link to 5. Label each place with its name")
1. With the new layer selected, open **Style › Text** and select **Text Field**.
2. Type `|name|` in the box. The bars mean "the value of this field", so every place is labelled with its own name. You can also click the `name` chip under "Fields on this layer's data".
3. Select **Inner Color** and pick a colour for the text, then **Inner Size** to make it larger or smaller.
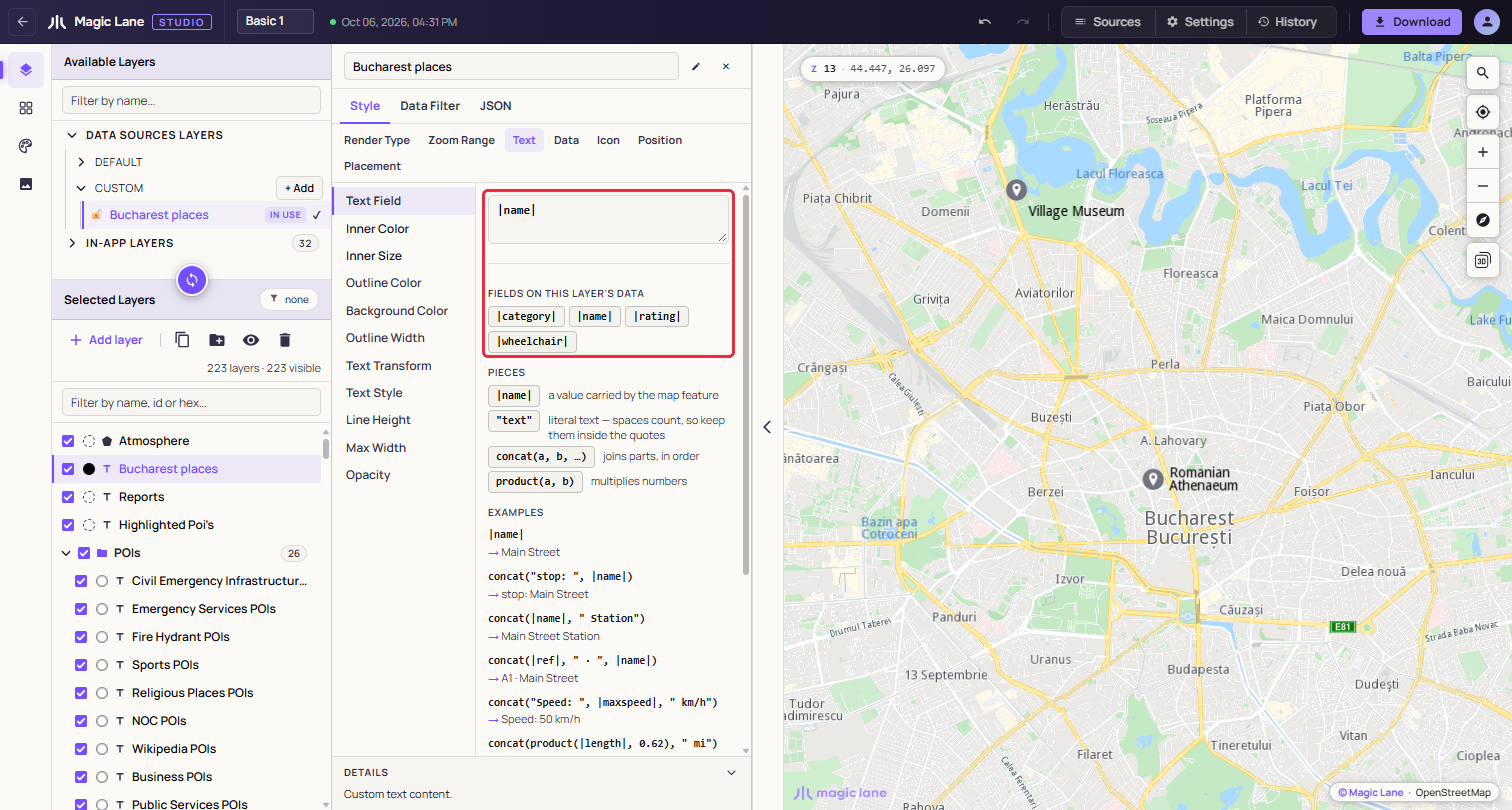
**Text Field reads |name|, so each place is labelled with its own name.**
To add a word to every label, combine pieces: `concat(|name|, " (", |category|, ")")` reads "Obor Market (food)".
## 6. Show only one category[](#6-show-only-one-category "Direct link to 6. Show only one category")
1. Open the **Data Filter** tab and click **Add Filter**.
2. In the first dropdown, pick `category`. In the second, pick **equals**.
3. Click the value chip and pick `culture`. The map now shows only the three museums and concert halls, and the panel counts the matches.
4. To show more than one category, pick **is any of** and select each value. **Remove filter** shows all eight places again.
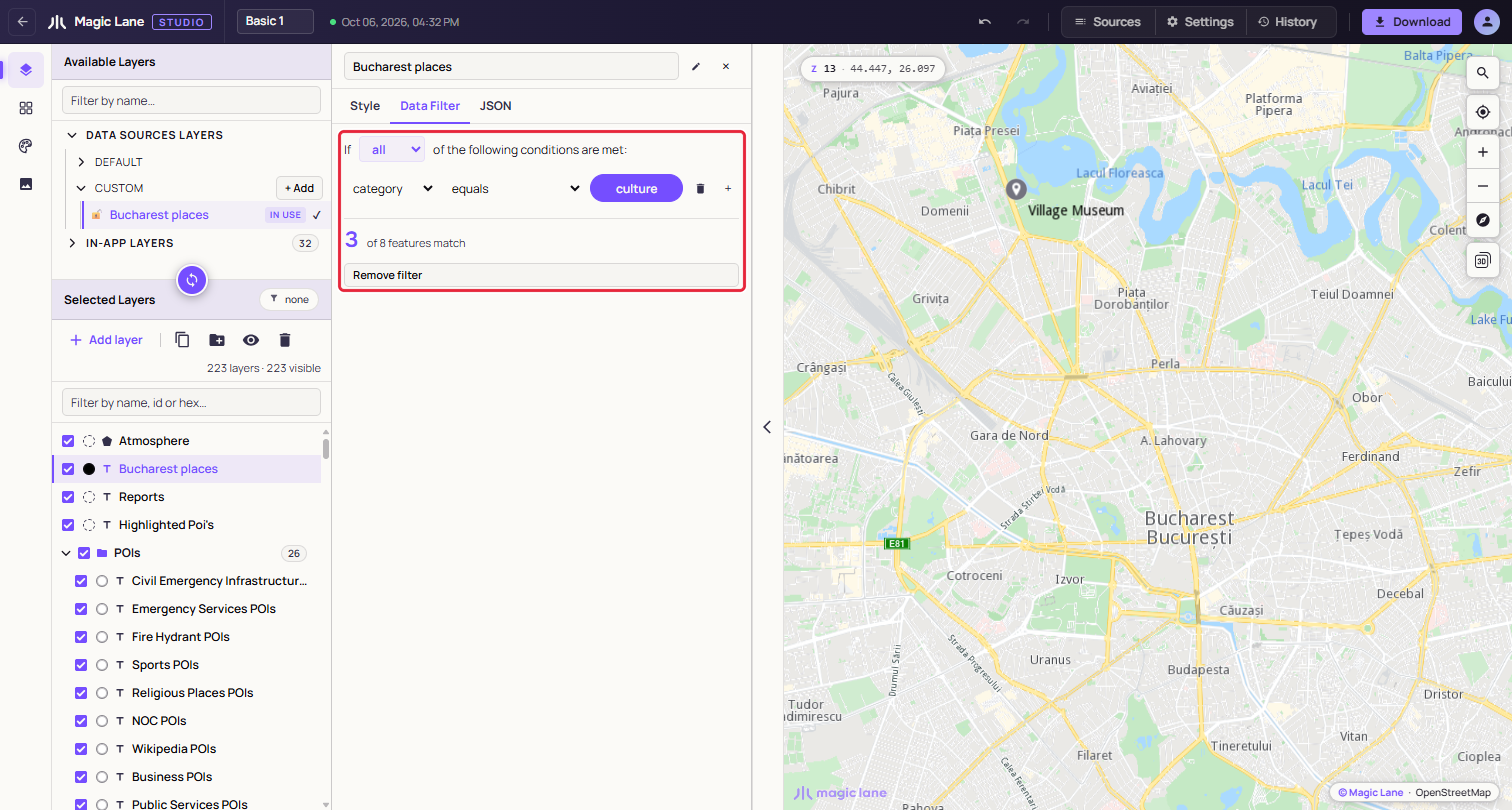
**category equals culture: the layer draws only the matching places, and the panel counts them.**
## Finished product[](#finished-product "Direct link to Finished product")
Your style now carries your own data as a layer: eight places in Bucharest, labelled with their names, filtered to one category. Download the style as in [Download](/docs/guides/map-studio/getting-started/download-and-use.md), and the layer goes with it.
## Next steps[](#next-steps "Direct link to Next steps")
* Give the places your own icon: [The image library](/docs/guides/map-studio/editing/image-library.md).
* Draw points, lines and areas yourself: [Drawing on the map](/docs/guides/map-studio/data/drawing-on-the-map.md).
* Add or edit the fields of a place: [Features and their properties](/docs/guides/map-studio/data/data-sources.md#features-and-their-properties).