# Route Profile
Last updated:
October 18, 2026
\| 19 minutes read
In this guide you will learn how to display a map, calculate routes between multiple points, and show a detailed route profile.
## How it Works[](#how-it-works "Direct link to How it Works")
This example demonstrates the following key features:
* Calculates routes and renders them on the map.
* Renders the route on a map, including alternative or multiple routes (if available).
* Provides interactive profile insights: elevation changes, slope/climbs, road & surface types.
* Lets you filter or highlight specific attributes (e.g. steepness, surface) and see how those segments behave both graphically (chart) and geographically (on the map).
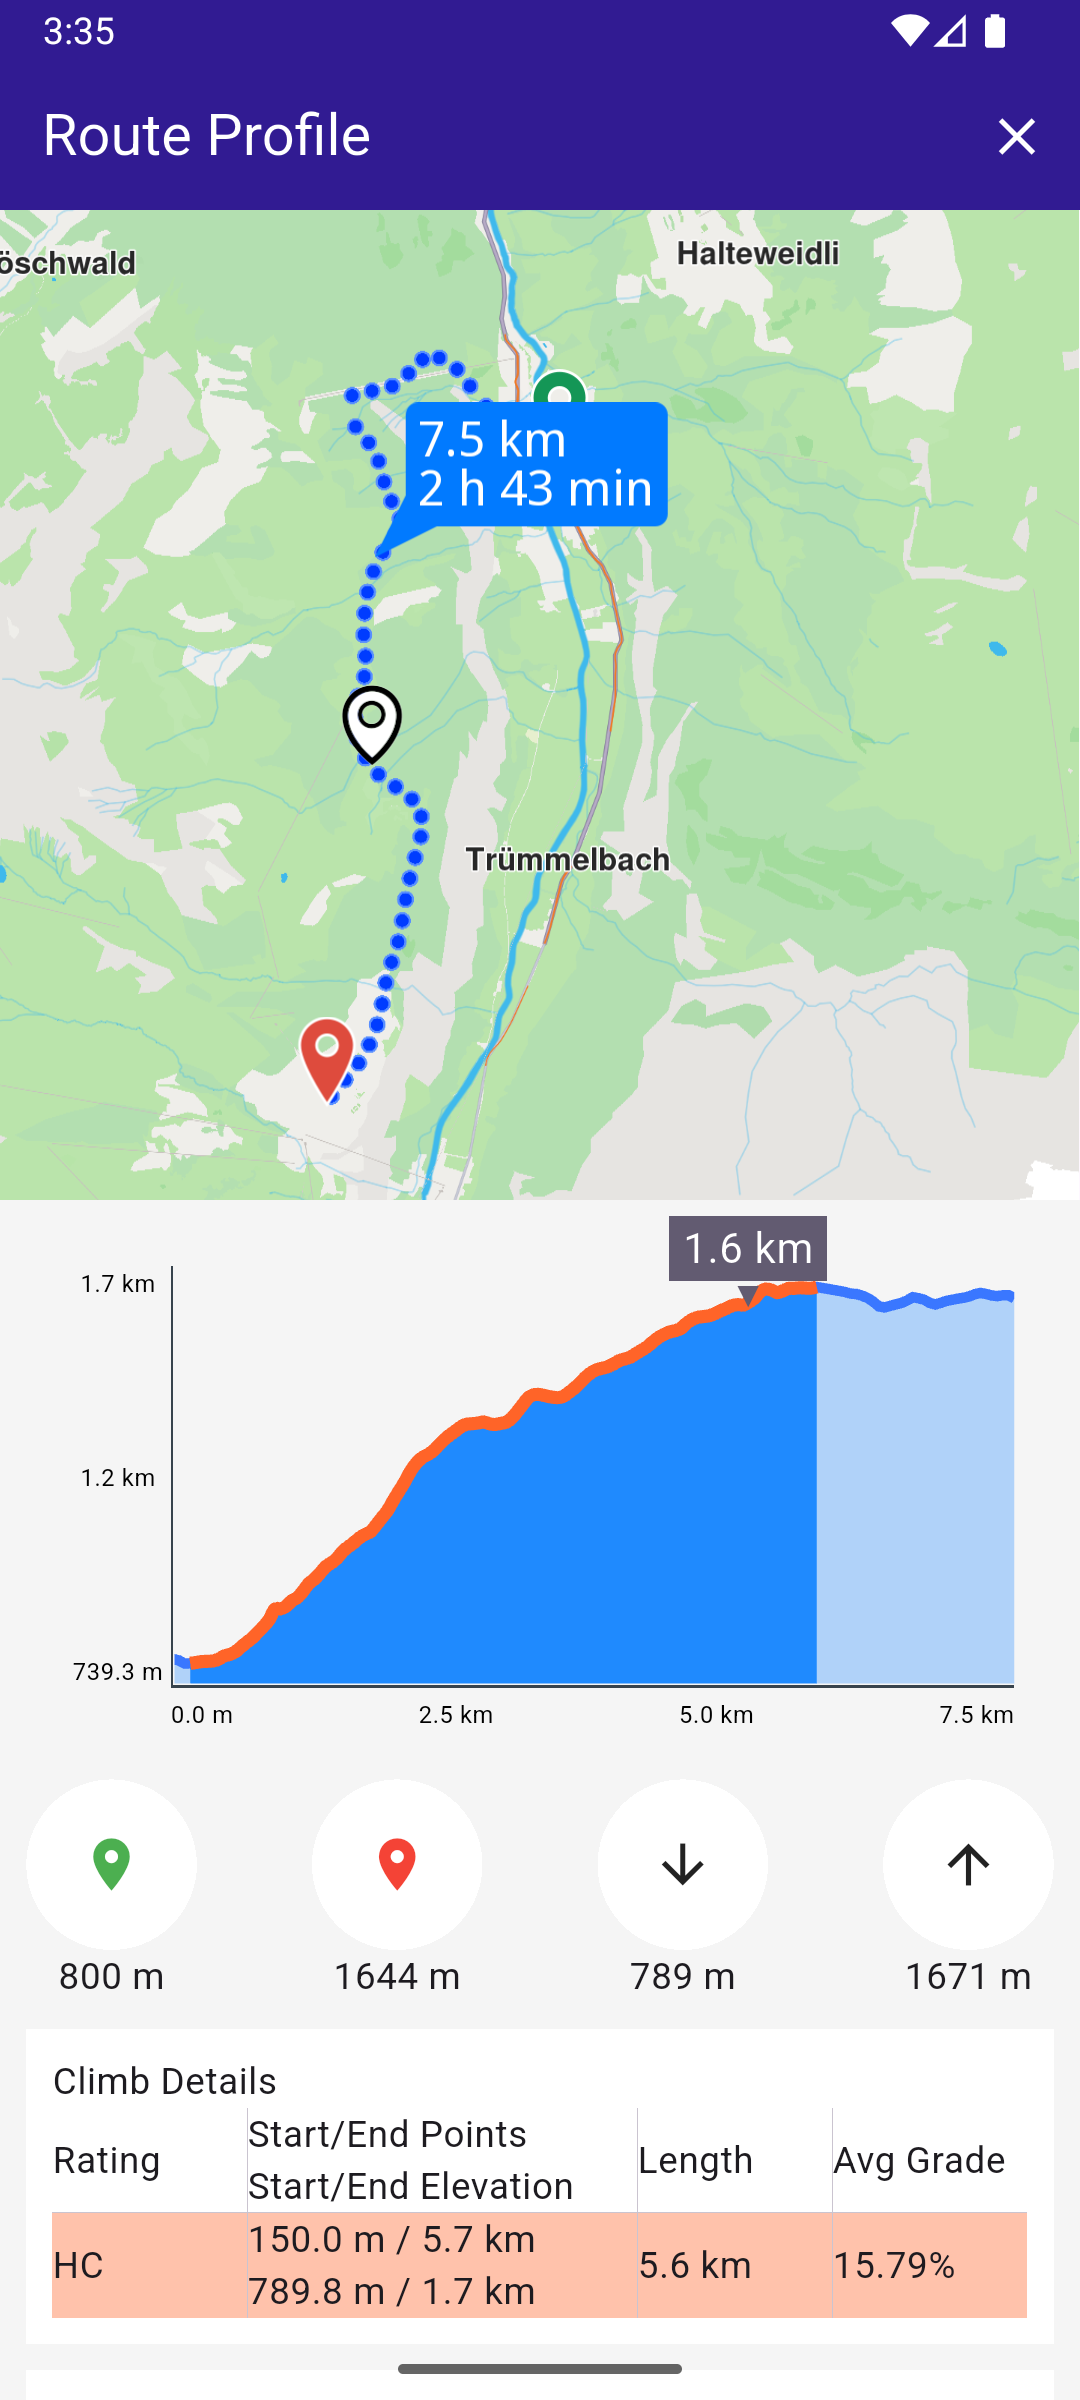
**Elevation chart**
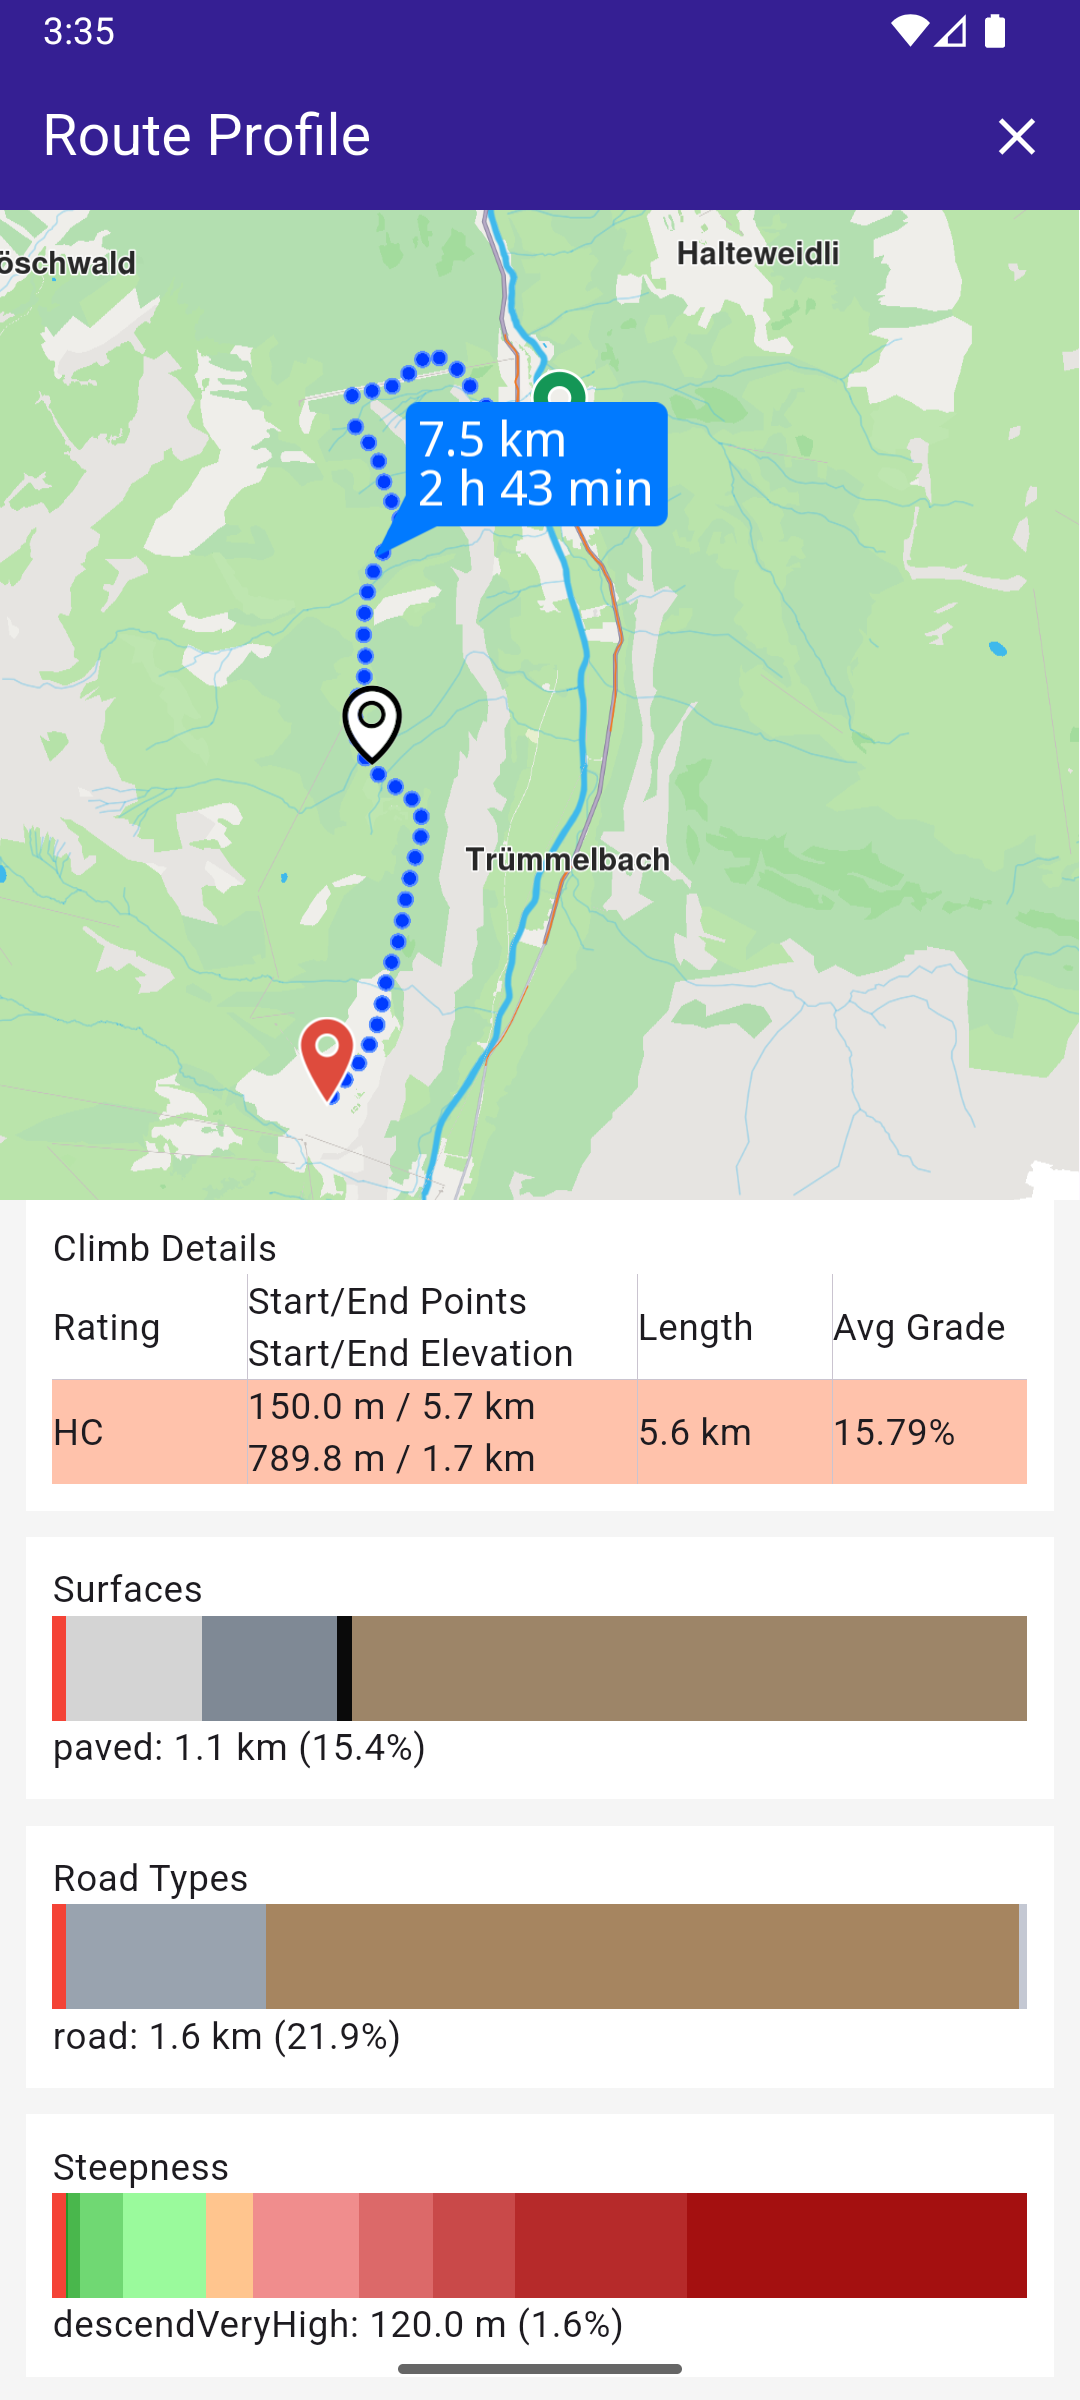
**Detailed route profile**
### UI and Map Integration[](#ui-and-map-integration "Direct link to UI and Map Integration")
The following code demonstrates how to create a UI with a `GemMap` and an app bar featuring a "Build Route" button. After the route is calculated, a scrollable route profile panel appears at the bottom of the screen, along with a close button in the top-right corner of the app bar.
main.dart[View on Github](https://github.com/magiclane/magiclane-maps-sdk-examples-for-flutter/tree/main/route_profile/lib/main.dart?ref_type=heads#L17)
```dart
void main() {
runApp(const MyApp());
}
class MyApp extends StatelessWidget {
const MyApp({super.key});
@override
Widget build(BuildContext context) {
return const MaterialApp(
debugShowCheckedModeBanner: false,
title: 'Route Profile',
home: MyHomePage(),
);
}
}
class MyHomePage extends StatefulWidget {
const MyHomePage({super.key});
@override
State createState() => _MyHomePageState();
}
class _MyHomePageState extends State {
late GemMapController _mapController;
// We use the handler to cancel the route calculation.
TaskHandler? _routingHandler;
Route? _focusedRoute;
final ElevationChartController _chartController = ElevationChartController();
@override
void dispose() {
GemKit.release();
super.dispose();
}
@override
Widget build(BuildContext context) {
return Scaffold(
appBar: AppBar(
backgroundColor: Colors.deepPurple[900],
title: const Text(
'Route Profile',
style: TextStyle(color: Colors.white),
),
actions: [
// Routes are not built.
if (_routingHandler == null && _focusedRoute == null)
IconButton(
onPressed: () => _onBuildRouteButtonPressed(context),
icon: const Icon(Icons.route, color: Colors.white),
),
// Routes calculating is in progress.
if (_routingHandler != null)
IconButton(
onPressed: () => _onCancelRouteButtonPressed(),
icon: const Icon(Icons.stop, color: Colors.white),
),
// Routes calculating is finished.
if (_focusedRoute != null)
IconButton(
onPressed: () => _onClearRoutesButtonPressed(),
icon: const Icon(Icons.clear, color: Colors.white),
),
],
),
body: Stack(
children: [
GemMap(
key: ValueKey("GemMap"),
onMapCreated: _onMapCreated,
appAuthorization: projectApiToken,
),
if (_focusedRoute != null)
Align(
alignment: Alignment.bottomCenter,
child: RouteProfilePanel(
route: _focusedRoute!,
mapController: _mapController,
chartController: _chartController,
centerOnRoute: () => _centerOnRoute([_focusedRoute!]),
),
),
],
),
);
}
// The callback for when map is ready to use.
Future _onMapCreated(GemMapController controller) async {
// Save controller for further usage.
_mapController = controller;
// Register route tap gesture callback.
await _registerRouteTapCallback();
}
void _onBuildRouteButtonPressed(BuildContext context) {
// Define the departure.
final departureLandmark = Landmark.withLatLng(
latitude: 46.59344,
longitude: 7.91069,
);
// Define the destination.
final destinationLandmark = Landmark.withLatLng(
latitude: 46.55945,
longitude: 7.89293,
);
// Define the route preferences.
// Terrain profile has to be enabled for this example to work.
final routePreferences = RoutePreferences(
buildTerrainProfile: const BuildTerrainProfile(enable: true),
transportMode: RouteTransportMode.pedestrian,
);
_showSnackBar(context, message: "The route is being calculated.");
// Calling the calculateRoute SDK method.
// (err, results) - is a callback function that gets called when the route computing is finished.
// err is an error enum, results is a list of routes.
_routingHandler = RoutingService.calculateRoute(
[departureLandmark, destinationLandmark],
routePreferences,
(err, routes) {
// If the route calculation is finished, we don't have a progress listener anymore.
_routingHandler = null;
ScaffoldMessenger.of(context).clearSnackBars();
// If there aren't any errors, we display the routes.
if (err == GemError.success) {
// Get the routes collection from map preferences.
final routesMap = _mapController.preferences.routes;
// Display the routes on map.
for (final route in routes) {
routesMap.add(
route,
route == routes.first,
label: getMapLabel(route),
);
}
// Center the camera on routes.
_centerOnRoute(routes);
setState(() {
_focusedRoute = routes.first;
});
}
},
);
setState(() {});
}
void _onClearRoutesButtonPressed() {
_mapController.preferences.paths.clear();
// Remove the routes from map.
_mapController.preferences.routes.clear();
setState(() {
_focusedRoute = null;
});
}
void _onCancelRouteButtonPressed() {
// If we have a progress listener we cancel the route calculation.
if (_routingHandler != null) {
RoutingService.cancelRoute(_routingHandler!);
setState(() {
_routingHandler = null;
});
}
}
// In order to be able to select an alternative route, we have to register the route tap gesture callback.
Future _registerRouteTapCallback() async {
// Register the generic map touch gesture.
_mapController.registerOnTouch((pos) async {
// Select the map objects at gives position.
await _mapController.setCursorScreenPosition(pos);
// Get the selected routes.
final routes = _mapController.cursorSelectionRoutes();
// If there is a route at position, we select it as the main one on the map.
if (routes.isNotEmpty) {
_mapController.preferences.routes.mainRoute = routes.first;
// Reset the highlight on the chart.
if (_chartController.setCurrentHighlight != null) {
_chartController.setCurrentHighlight!(0);
}
setState(() {
_focusedRoute = routes.first;
});
// Center the camera on the main route.
_centerOnRoute([_focusedRoute!]);
}
});
}
void _centerOnRoute(List route) {
const appbarHeight = 50;
const padding = 20;
// Use the map controller to center on route above the panel.
_mapController.centerOnRoutes(
routes: route,
screenRect: Rectangle(
0,
(appbarHeight + padding * MediaQuery.of(context).devicePixelRatio)
.toInt(),
(MediaQuery.of(context).size.width *
MediaQuery.of(context).devicePixelRatio)
.toInt(),
((MediaQuery.of(context).size.height / 2 -
appbarHeight -
2 * padding * MediaQuery.of(context).devicePixelRatio) *
MediaQuery.of(context).devicePixelRatio)
.toInt(),
),
);
}
// Show a snackbar indicating that the route calculation is in progress.
void _showSnackBar(
BuildContext context, {
required String message,
Duration duration = const Duration(hours: 1),
}) {
final snackBar = SnackBar(content: Text(message), duration: duration);
ScaffoldMessenger.of(context).showSnackBar(snackBar);
}
}
String getMapLabel(Route route) {
return '${convertDistance(route.getTimeDistance().totalDistanceM)} \n${convertDuration(route.getTimeDistance().totalTimeS)}';
}
```
### Steepness Classification[](#steepness-classification "Direct link to Steepness Classification")
The Magic Lane SDK allows you to analyze the **slope of a route** by dividing it into segments of varying steepness.
This is especially useful for hiking and cycling apps where slope difficulty is a critical factor.
#### Steepness in the Example[](#steepness-in-the-example "Direct link to Steepness in the Example")
In the example project, we define a `Steepness` enum to make slope information easier to interpret and display.
utils.dart[View on Github](https://github.com/magiclane/magiclane-maps-sdk-examples-for-flutter/tree/main/route_profile/lib/utils.dart?ref_type=heads#L10)
```dart
enum Steepness {
descendExtreme,
descendVeryHigh,
descendHigh,
descendLow,
descendVeryLow,
neutral,
ascendVeryLow,
ascendLow,
ascendHigh,
ascendVeryHigh,
ascendExtreme,
}
```
This enum provides **user-friendly labels** for slope categories.
It covers both *descending* and *ascending* gradients, with `neutral` representing nearly flat terrain.
* **Descending categories** → from `descendExtreme` (very steep downhill) to `descendVeryLow` (slight downhill).
* **Neutral** → flat or almost flat terrain.
* **Ascending categories** → from `ascendVeryLow` (gentle uphill) to `ascendExtreme` (very steep uphill).
In the example, these values are **mapped to slope thresholds** (defined when calling `getSteepSections`) and also **assigned colors** for visualization in charts or maps.
For instance:
* Steep downhills are mapped to shades of green.
* Neutral terrain is shown in orange.
* Steep uphills are mapped to shades of red.
This way, the elevation chart and route visualization become **intuitive**: the color directly reflects how hard the climb or descent is.
#### Example Mapping[](#example-mapping "Direct link to Example Mapping")
Using the example `categs` above:
* Slopes `< -16%` → `descendExtreme`
* Between `-10%` and `-7%` → `descendHigh`
* Between `4%` and `7%` → `ascendLow`
* Slopes `> 16%` → `ascendExtreme`
This allows **custom flexibility**: you can tune the thresholds to your application's needs (e.g., more sensitive slope categories for mountain biking vs. walking).
## Climb Details[](#climb-details "Direct link to Climb Details")
The example project also includes a **Climb Details panel**.
This widget takes a calculated route and shows a breakdown of its **climb segments** in a structured table.
climb\_details.dart[View on Github](https://github.com/magiclane/magiclane-maps-sdk-examples-for-flutter/tree/main/route_profile/lib/climb_details.dart?ref_type=heads#L11)
```dart
class ClimbDetails extends StatelessWidget {
final Route route;
const ClimbDetails({super.key, required this.route});
@override
Widget build(BuildContext context) {
return Container(
color: Colors.white,
padding: const EdgeInsets.all(10.0),
child: Column(
crossAxisAlignment: CrossAxisAlignment.start,
children: [
const Text('Climb Details'),
Table(
border: TableBorder(
verticalInside: BorderSide(
width: 0.5,
color: Theme.of(context).colorScheme.outlineVariant,
style: BorderStyle.solid,
),
horizontalInside: BorderSide(
width: 0.5,
color: Theme.of(context).colorScheme.outlineVariant,
style: BorderStyle.solid,
),
),
defaultVerticalAlignment: TableCellVerticalAlignment.middle,
columnWidths: const {
0: FlexColumnWidth(1),
1: FlexColumnWidth(2),
2: FlexColumnWidth(1),
3: FlexColumnWidth(1),
},
children: [
const TableRow(
children: [
Text('Rating'),
Text("Start/End Points\nStart/End Elevation", maxLines: 2),
Text("Length", maxLines: 1),
Text("Avg Grade", maxLines: 2),
],
),
for (final section in route.terrainProfile!.climbSections)
TableRow(
decoration: BoxDecoration(color: getGradeColor(section)),
children: [
Text(_getGradeString(section.grade)),
Text(
'${convertDistance(section.startDistanceM.toDouble())} / ${convertDistance(section.endDistanceM.toDouble())}\n${convertDistance(_getSectionStartElevation(section))} / ${convertDistance(_getSectionEndElevation(section))}',
maxLines: 2,
),
Text(
convertDistance(
(section.endDistanceM - section.startDistanceM)
.toDouble(),
),
maxLines: 2,
),
Text("${section.slope.toStringAsFixed(2)}%", maxLines: 2),
],
),
],
),
],
),
);
}
double _getSectionStartElevation(ClimbSection section) {
return route.terrainProfile!.getElevation(section.startDistanceM);
}
double _getSectionEndElevation(ClimbSection section) {
return route.terrainProfile!.getElevation(section.endDistanceM);
}
String _getGradeString(Grade grade) {
switch (grade) {
case Grade.grade1:
return "1";
case Grade.grade2:
return "2";
case Grade.grade3:
return "3";
case Grade.grade4:
return "4";
case Grade.gradeHC:
return "HC";
}
}
}
```
## How It Works[](#how-it-works-1 "Direct link to How It Works")
* **Input** → the widget takes a `Route` with a populated `terrainProfile`.
* **Loop** → for each `ClimbSection`, a row is added to the table.
* **Color** → each row background is set with `getGradeColor(section)`, giving a visual cue for difficulty.
* **Columns shown**:
* **Rating** → the climb’s grade (1–4 or HC).
* **Start/End Points & Elevation** → distance along the route and elevation values.
* **Length** → climb distance.
* **Avg Grade** → average slope percentage.
This table complements the elevation chart by giving **precise numeric details**:
* Cyclists can check how long and steep each climb is.
* Hikers can quickly see elevation gain across segments.
* The color-coded difficulty helps users identify the toughest sections at a glance.
### Elevation Chart[](#elevation-chart "Direct link to Elevation Chart")
The `ElevationChart` is the **interactive visualization** at the heart of the route profile.
It plots the elevation of the route, highlights climb sections, and supports rich interactions like **zooming, panning, and tooltips**.
### Features[](#features "Direct link to Features")
* **Line + Area Chart** → powered by `fl_chart`, showing elevation along distance.
* **Colored intervals** → climb segments are highlighted using `getGradeColor`, so users see difficulty at a glance.
* **Interactive gestures**:
* One-finger drag → move the highlight cursor.
* Two-finger drag → pan left/right.
* Pinch → zoom horizontally on the elevation axis.
* **Tooltip** → shows the elevation at the highlighted position.
* **Custom axes** → left Y-axis for elevation, bottom X-axis for distance.
elevation\_chart.dart[View on Github](https://github.com/magiclane/magiclane-maps-sdk-examples-for-flutter/tree/main/route_profile/lib/elevation_chart.dart?ref_type=heads#L14)
```dart
class ElevationChartController {
void Function(double)? setCurrentHighlight;
void Function(double, double)? changeViewport;
}
class ElevationChart extends StatefulWidget {
final void Function(double leftX, double rightX)? onViewPortChanged;
final void Function(double x)? onSelect;
final ElevationChartController controller;
late final double maxY;
late final double minY;
late final double maxX;
late final double minX;
static const double leftLabelBarWidth = 40;
static const double bottomLabelBarHeight = 20;
static const double tooptipWidth = 60;
late final List spots;
final List<(List, Color)> highlightedIntervals = [];
final List<(double, double, Color)> highlightedColoredIntervals = [];
final List climbSections;
final Color legendLabelColor;
final Color? indicatorColor;
final bool isInteractive;
ElevationChart({
super.key,
required this.controller,
required List<(double, double)> points,
required this.climbSections,
this.onSelect,
this.onViewPortChanged,
this.legendLabelColor = Colors.black,
this.indicatorColor,
this.isInteractive = true,
}) {
spots = points.map((e) => FlSpot(e.$1, e.$2)).toList();
if (spots.isEmpty) {
maxY = 0;
minY = 0;
maxX = 0;
minX = 0;
} else {
maxY = spots.map((e) => e.y).reduce(max) + 50;
minY = spots.map((e) => e.y).reduce(min) - 50;
maxX = spots.map((e) => e.x).reduce(max);
minX = spots.map((e) => e.x).reduce(min);
}
for (var climbSection in climbSections) {
final Color highligthedColor = getGradeColor(climbSection).withAlpha(255);
highlightedColoredIntervals.add((
climbSection.startDistanceM.toDouble(),
climbSection.endDistanceM.toDouble(),
highligthedColor,
));
}
for (final interval in highlightedColoredIntervals) {
final intervalStart = interval.$1;
final intervalEnd = interval.$2;
final intervalColor = interval.$3;
final affectedSpots = spots
.where(
(element) => element.x >= intervalStart && element.x <= intervalEnd,
)
.toList();
highlightedIntervals.add((affectedSpots, intervalColor));
}
}
void setCurrentHighlight(double value) {
state._setCurrentHighlight(value);
}
// ignore: library_private_types_in_public_api
late final _LineAreaChartState state;
@override
// ignore: no_logic_in_create_state
State createState() {
state = _LineAreaChartState();
return state;
}
}
class _LineAreaChartState extends State {
late double _currentLeftX;
late double _currentRightX;
double get _currentSectionLength => _currentRightX - _currentLeftX;
double get _currentMiddleX => (_currentLeftX + _currentRightX) * 0.5;
FlSpot? _currentSpot;
double? get _currentHighlightX => _currentSpot?.x;
double? get _currentHighlightY => _currentSpot?.y;
int _timestampLastTwoFingersGesture = 0;
int _timestampLastScaleGesture = 0;
double _scaleOriginXMovingAverage = 0;
Timer? _timerUntilOnViewportUpdate;
_ViewportController viewportController = _ViewportController();
_TooltipController tooltipController = _TooltipController();
_TitleBarController titleBarController = _TitleBarController();
@override
void initState() {
super.initState();
resetMarginsAndHighlight();
}
@override
void didUpdateWidget(covariant ElevationChart oldWidget) {
super.didUpdateWidget(oldWidget);
resetMarginsAndHighlight();
}
void resetMarginsAndHighlight() {
_currentLeftX = widget.minX;
_currentRightX = widget.maxX;
widget.controller.setCurrentHighlight = _setCurrentHighlight;
widget.controller.changeViewport = _updatePresentedDomainLimits;
viewportController.changeViewport(_currentLeftX, _currentRightX);
titleBarController.horizontalAxisViewportChanged(
_currentLeftX,
_currentRightX,
);
titleBarController.verticalAxisViewportChanged(widget.minY, widget.maxY);
}
void _setCurrentHighlight(double value) {
if ((value - (_currentHighlightX ?? double.infinity)).abs() <
_currentSectionLength * 0.03 &&
widget.isInteractive) {
return;
}
if (!mounted) return;
FlSpot closestSpot = widget.spots.first;
for (final spot in widget.spots) {
if ((closestSpot.x - value).abs() > (spot.x - value).abs()) {
closestSpot = spot;
}
}
if (_currentSpot != null && _currentSpot!.x == closestSpot.x) return;
_currentSpot = closestSpot;
tooltipController.setHighlight(_currentSpot);
widget.onSelect?.call(closestSpot.x);
}
void _updatePresentedDomainLimits(double newMinX, double newMaxX) {
_currentLeftX = newMinX;
_currentRightX = newMaxX;
viewportController.changeViewport(_currentLeftX, _currentRightX);
titleBarController.horizontalAxisViewportChanged(
_currentLeftX,
_currentRightX,
);
tooltipController.triggerRebuild();
if (widget.onViewPortChanged == null) return;
_timerUntilOnViewportUpdate?.cancel();
_timerUntilOnViewportUpdate = Timer(const Duration(milliseconds: 200), () {
widget.onViewPortChanged!(_currentLeftX, _currentRightX);
});
}
void _moveMiddleTowardsX(double x) {
final leftXWhenXInMiddle = x - _currentSectionLength * 0.5;
final rightXWhenXInMiddle = x + _currentSectionLength * 0.5;
const lerpCoefficient = 0.01;
final newLeftXInterpolated =
_currentLeftX * (1 - lerpCoefficient) +
leftXWhenXInMiddle * lerpCoefficient;
final newRightXInterpolated =
_currentRightX * (1 - lerpCoefficient) +
rightXWhenXInMiddle * lerpCoefficient;
_updatePresentedDomainLimits(newLeftXInterpolated, newRightXInterpolated);
}
double _getXAtWidthPercentage(double widthPercentage) {
return _currentSectionLength * widthPercentage + _currentLeftX;
}
double _getTooltipXOffset(double widgetWidth) {
return (_currentHighlightX! - _currentLeftX) /
(_currentRightX - _currentLeftX) *
widgetWidth -
ElevationChart.tooptipWidth / 2;
}
double _getTooltipYOffset(double widgetHeight) {
return (_currentHighlightY! - widget.minY) /
(widget.maxY - widget.minY) *
widgetHeight;
}
@override
Widget build(BuildContext context) {
return ConstrainedBox(
constraints: const BoxConstraints(minWidth: 0, minHeight: 0),
child: AspectRatio(
aspectRatio: 2,
child: Column(
children: [
Expanded(
child: Row(
children: [
_LeftTitleBar(
originalMinY: widget.minY,
originalMaxY: widget.maxY,
intervalsCount: 3,
bottomOffset: 0,
barWidth: ElevationChart.leftLabelBarWidth,
textColor: widget.legendLabelColor,
controller: titleBarController,
),
Expanded(
child: _ChartGestureDetector(
hasGestures: widget.isInteractive,
onDragWithOneFinger: (percentageOfChartWidth) {
if (DateTime.now().millisecondsSinceEpoch -
_timestampLastTwoFingersGesture <
50) {
return;
}
final highlightedDistance = _getXAtWidthPercentage(
percentageOfChartWidth,
);
_setCurrentHighlight(highlightedDistance);
_timestampLastTwoFingersGesture =
DateTime.now().millisecondsSinceEpoch;
},
onDragWithTwoFingers: (deltaXOffset) {
deltaXOffset =
deltaXOffset * _currentSectionLength * 0.0050;
final newMinX = _currentLeftX + deltaXOffset;
final newMaxX = _currentRightX + deltaXOffset;
if (newMinX < widget.minX) {
return;
}
if (newMaxX > widget.maxX) {
return;
}
_updatePresentedDomainLimits(newMinX, newMaxX);
_timestampLastTwoFingersGesture =
DateTime.now().millisecondsSinceEpoch;
},
onScale: (percentageOfChartWidth, horizontalScale) {
// Move towards scale's point of origin
final startScaleXOrigin = _getXAtWidthPercentage(
percentageOfChartWidth,
);
if (DateTime.now().millisecondsSinceEpoch -
_timestampLastScaleGesture >
200) {
_scaleOriginXMovingAverage = startScaleXOrigin;
} else {
const newPositionWeight = 0.01;
_scaleOriginXMovingAverage =
newPositionWeight * startScaleXOrigin +
(1 - newPositionWeight) *
_scaleOriginXMovingAverage;
}
_moveMiddleTowardsX(_scaleOriginXMovingAverage);
// Scale
horizontalScale = 1 / horizontalScale;
const lerpCoefficient = 0.01;
horizontalScale =
horizontalScale * lerpCoefficient +
(1 - lerpCoefficient);
final newLength =
_currentSectionLength * horizontalScale;
var newMinX = _currentMiddleX - newLength / 2;
var newMaxX = _currentMiddleX + newLength / 2;
if (newMinX < widget.minX) newMinX = widget.minX;
if (newMaxX > widget.maxX) newMaxX = widget.maxX;
double delta = newMaxX - newMinX;
if (delta < 10) return;
_updatePresentedDomainLimits(newMinX, newMaxX);
_timestampLastTwoFingersGesture =
DateTime.now().millisecondsSinceEpoch;
_timestampLastScaleGesture =
DateTime.now().millisecondsSinceEpoch;
},
child: AbsorbPointer(
child: LayoutBuilder(
builder: (context, widgetConstrains) {
return Stack(
clipBehavior: Clip.none,
fit: StackFit.expand,
children: [
_Chart(
minY: widget.minY,
maxY: widget.maxY,
minX: widget.minX,
maxX: widget.maxX,
spots: widget.spots,
highlightedIntervals:
widget.highlightedIntervals,
viewportController: viewportController,
),
_ChartTooptip(
xOffset: _getTooltipXOffset,
yOffset: _getTooltipYOffset,
indicatorColor:
widget.indicatorColor ??
Theme.of(context).colorScheme.secondary,
maxWidgetWidth: widgetConstrains.maxWidth,
maxWidgetHeight: widgetConstrains.maxHeight,
controller: tooltipController,
textColor: widget.indicatorColor == null
? Theme.of(
context,
).colorScheme.onSecondary
: Colors.black,
),
],
);
},
),
),
),
),
],
),
),
_BottomTitleBar(
originalMinX: _currentLeftX,
originalMaxX: _currentRightX,
intervalsCount: 4,
textColor: widget.legendLabelColor,
barHeight: ElevationChart.bottomLabelBarHeight,
leftOffset: ElevationChart.leftLabelBarWidth,
controller: titleBarController,
),
],
),
),
);
}
}
class _TooltipController {
void Function(FlSpot?) setHighlight = (_) {};
void Function() triggerRebuild = () {};
}
class _ChartTooptip extends StatefulWidget {
const _ChartTooptip({
required this.xOffset,
required this.yOffset,
required this.indicatorColor,
required this.maxWidgetWidth,
required this.maxWidgetHeight,
required this.controller,
required this.textColor,
});
final double Function(double) xOffset;
final double Function(double) yOffset;
final double maxWidgetWidth;
final double maxWidgetHeight;
final _TooltipController controller;
final Color indicatorColor;
final Color textColor;
@override
State<_ChartTooptip> createState() => _ChartTooptipState();
}
class _ChartTooptipState extends State<_ChartTooptip> {
FlSpot? highlight;
@override
void initState() {
super.initState();
_rebindControler();
}
@override
void didChangeDependencies() {
super.didChangeDependencies();
_rebindControler();
}
void _rebindControler() {
widget.controller.setHighlight = (spot) => setState(() {
highlight = spot;
});
widget.controller.triggerRebuild = () => setState(() {});
}
@override
Widget build(BuildContext context) {
if (highlight == null) return Container();
final offsetX = widget.xOffset(widget.maxWidgetWidth);
final offsetY = widget.yOffset(widget.maxWidgetHeight);
if (offsetX < -ElevationChart.tooptipWidth / 2 ||
offsetX > widget.maxWidgetWidth - ElevationChart.tooptipWidth / 2) {
return Container();
}
return Positioned(
left: offsetX,
bottom: offsetY,
child: SizedBox(
width: ElevationChart.tooptipWidth,
child: Column(
mainAxisSize: MainAxisSize.min,
children: [
Container(
height: 25,
padding: const EdgeInsets.symmetric(horizontal: 5),
decoration: BoxDecoration(color: widget.indicatorColor),
child: Center(
child: FittedBox(
fit: BoxFit.contain,
child: Text(
convertDistance(highlight!.y),
style: TextStyle(fontSize: 16, color: widget.textColor),
),
),
),
),
Text(
"▼",
style: TextStyle(color: widget.indicatorColor, height: 0.6),
),
],
),
),
);
}
}
class _ViewportController {
void Function(double, double) changeViewport = (a, b) {};
}
class _Chart extends StatefulWidget {
const _Chart({
required this.minY,
required this.maxY,
required this.minX,
required this.maxX,
required this.spots,
required this.highlightedIntervals,
required this.viewportController,
});
final double minY;
final double maxY;
final double minX;
final double maxX;
final List spots;
final List<(List, Color)> highlightedIntervals;
final _ViewportController viewportController;
@override
State<_Chart> createState() => _ChartState();
}
class _ChartState extends State<_Chart> {
late double currentLeftX;
late double currentRightX;
@override
void initState() {
super.initState();
currentLeftX = widget.minX;
currentRightX = widget.maxX;
_rebindController();
}
@override
void didChangeDependencies() {
super.didChangeDependencies();
_rebindController();
}
void _rebindController() {
widget.viewportController.changeViewport = (left, right) {
setState(() {
currentLeftX = left;
currentRightX = right;
});
};
}
@override
Widget build(BuildContext context) {
return LineChart(
LineChartData(
titlesData: const FlTitlesData(
bottomTitles: AxisTitles(sideTitles: SideTitles(showTitles: false)),
topTitles: AxisTitles(sideTitles: SideTitles(showTitles: false)),
leftTitles: AxisTitles(sideTitles: SideTitles(showTitles: false)),
rightTitles: AxisTitles(sideTitles: SideTitles(showTitles: false)),
),
maxY: widget.maxY,
minY: widget.minY,
maxX: currentRightX,
minX: currentLeftX,
// Data
lineBarsData: [
LineChartBarData(
spots: widget.spots,
isCurved: false,
barWidth: 4,
color: const Color(0xFF3a77ff),
dotData: const FlDotData(show: false),
belowBarData: BarAreaData(
show: true,
color: const Color.fromARGB(200, 157, 200, 250),
),
),
for (final interval in widget.highlightedIntervals)
LineChartBarData(
spots: interval.$1,
isCurved: true,
barWidth: 5,
color: interval.$2,
dotData: const FlDotData(show: false),
belowBarData: BarAreaData(
show: true,
color: const Color(0xFF1F8AFE),
),
),
],
// Background grid
gridData: const FlGridData(
show: false,
drawVerticalLine: false,
horizontalInterval: 1000,
verticalInterval: 100,
),
//Border
borderData: FlBorderData(
show: true,
border: const Border(
top: BorderSide(width: 0, color: Colors.transparent),
right: BorderSide(width: 0, color: Colors.transparent),
bottom: BorderSide(width: 1, color: Color(0xff37434d)),
left: BorderSide(width: 1, color: Color(0xff37434d)),
),
),
clipData: const FlClipData.all(),
),
);
}
}
class _TitleBarController {
void Function(double start, double end) verticalAxisViewportChanged =
(_, _) {};
void Function(double start, double end) horizontalAxisViewportChanged =
(_, _) {};
}
class _LeftTitleBar extends StatefulWidget {
final double originalMinY;
final double originalMaxY;
final int intervalsCount;
final double barWidth;
final double bottomOffset;
final _TitleBarController controller;
final Color textColor;
const _LeftTitleBar({
required this.originalMinY,
required this.originalMaxY,
required this.intervalsCount,
required this.barWidth,
required this.bottomOffset,
required this.textColor,
required this.controller,
});
@override
State<_LeftTitleBar> createState() => _LeftTitleBarState();
}
class _LeftTitleBarState extends State<_LeftTitleBar> {
double minY = 0;
double maxY = 0;
@override
void initState() {
super.initState();
minY = widget.originalMinY;
maxY = widget.originalMaxY;
_bindController();
}
@override
void didChangeDependencies() {
super.didChangeDependencies();
_bindController();
}
void _bindController() {
widget.controller.verticalAxisViewportChanged = (mn, mx) {
setState(() {
minY = mn;
maxY = mx;
});
};
}
double getValueAtInterval(int interval) {
return minY +
(maxY - minY) *
(widget.intervalsCount - interval - 1) /
(widget.intervalsCount - 1);
}
@override
Widget build(BuildContext context) {
return SizedBox(
width: widget.barWidth,
child: Column(
children: [
Expanded(
child: Column(
mainAxisAlignment: MainAxisAlignment.spaceBetween,
children: [
for (int i = 0; i < widget.intervalsCount; i++)
Text(
convertDistance(getValueAtInterval(i)),
style: TextStyle(fontSize: 9, color: widget.textColor),
textAlign: TextAlign.right,
),
],
),
),
SizedBox(height: widget.bottomOffset),
],
),
);
}
}
class _BottomTitleBar extends StatefulWidget {
final double originalMinX;
final double originalMaxX;
final int intervalsCount;
final double barHeight;
final double leftOffset;
final _TitleBarController controller;
final Color textColor;
const _BottomTitleBar({
required this.originalMinX,
required this.originalMaxX,
required this.intervalsCount,
required this.barHeight,
required this.leftOffset,
required this.textColor,
required this.controller,
});
@override
State<_BottomTitleBar> createState() => _BottomTitleBarState();
}
class _BottomTitleBarState extends State<_BottomTitleBar> {
double minX = 0;
double maxX = 0;
@override
void initState() {
super.initState();
minX = widget.originalMinX;
maxX = widget.originalMaxX;
_bindController();
}
@override
void didChangeDependencies() {
super.didChangeDependencies();
_bindController();
}
void _bindController() {
widget.controller.horizontalAxisViewportChanged = (mn, mx) {
setState(() {
minX = mn;
maxX = mx;
});
};
}
double getValueAtInterval(int interval) {
return minX + (maxX - minX) * interval / (widget.intervalsCount - 1);
}
@override
Widget build(BuildContext context) {
return SizedBox(
height: widget.barHeight,
child: Row(
children: [
SizedBox(width: widget.leftOffset),
Expanded(
child: Row(
mainAxisAlignment: MainAxisAlignment.spaceBetween,
children: [
for (int i = 0; i < widget.intervalsCount; i++)
Text(
convertDistance(getValueAtInterval(i)),
style: TextStyle(fontSize: 9, color: widget.textColor),
),
],
),
),
],
),
);
}
}
class _ChartGestureDetector extends StatelessWidget {
final void Function(double percentageOfChartWidth) onDragWithOneFinger;
final void Function(double deltaXOffset) onDragWithTwoFingers;
final void Function(
double percentageOfChartWidthStart,
double horizontalScale,
)
onScale;
final Widget child;
final bool hasGestures;
const _ChartGestureDetector({
required this.onDragWithOneFinger,
required this.onDragWithTwoFingers,
required this.onScale,
required this.hasGestures,
required this.child,
});
double getPercentageOfChartWidthFromXOffset(
double xOffset,
double widgetWidth,
) {
return xOffset / widgetWidth;
}
@override
Widget build(BuildContext context) {
return LayoutBuilder(
builder: (context, constrains) {
return GestureDetector(
onScaleUpdate: (details) {
if (!hasGestures) {
return;
}
// Higher than 1 -> gestures with high vertical range are more likely to be recognized
// Closer to 1 -> gestures with high vertical range are less likely to be recognized
const scaleV = 5;
// Higher than 1 -> the gesture has higher chance of being registered as DRAG TWO FINGERS
// Closer to 1 -> the gesture has higher chance of being registered as SCALE
const scaleH = 1.30;
// Ignore extreme vertical gestures
if (details.verticalScale < 1 / scaleV ||
details.verticalScale > scaleV) {
return;
}
if (details.scale < 1 / scaleH || details.scale > scaleH) {
// SCALE
final horizontalScale = details.horizontalScale;
final startLocalFocalPointX = details.localFocalPoint.dx;
final startPercentageX = getPercentageOfChartWidthFromXOffset(
startLocalFocalPointX,
constrains.maxWidth,
);
onScale(startPercentageX, horizontalScale);
} else if (details.pointerCount == 1) {
// DRAG ONE FINGER
final percentageOfWidgetX = getPercentageOfChartWidthFromXOffset(
details.localFocalPoint.dx,
constrains.maxWidth,
);
if (percentageOfWidgetX < 0 || percentageOfWidgetX > 1) return;
onDragWithOneFinger(percentageOfWidgetX);
} else if (details.pointerCount == 2) {
// DRAG TWO FINGERS
onDragWithTwoFingers(-details.focalPointDelta.dx);
}
},
child: child,
);
},
);
```
The state class (`_LineAreaChartState`) wires up gesture detection, viewport changes, and tooltips, while private widgets like `_Chart`, `_LeftTitleBar`, and `_BottomTitleBar` handle chart drawing and axis labels.
### What the User Sees[](#what-the-user-sees "Direct link to What the User Sees")
When embedded in the app, the chart shows:
* A **blue elevation profile** shaded under the curve.
* **Climb segments** overlaid in red/orange (based on grade).
* **Y-axis labels** → elevation values (meters).
* **X-axis labels** → distance (meters/kilometers).
* A **tooltip box** that appears when dragging, showing the elevation at the highlighted point.
The chart transforms a static route into an **explorable profile**.
Users can zoom in to inspect a steep climb, drag to preview specific sections, or just glance at colors to see where the toughest parts are.
### Utility Functions[](#utility-functions "Direct link to Utility Functions")
main.dart[View on Github](https://github.com/magiclane/magiclane-maps-sdk-examples-for-flutter/tree/main/route_profile/lib/main.dart?ref_type=heads#L268)
```dart
// Utility function to convert the meters distance into a suitable format.
String convertDistance(int meters) {
if (meters >= 1000) {
double kilometers = meters / 1000;
return '${kilometers.toStringAsFixed(1)} km';
} else {
return '${meters.toString()} m';
}
}
// Utility function to convert the seconds duration into a suitable format.
String convertDuration(int seconds) {
int hours = seconds ~/ 3600; // Number of whole hours
int minutes = (seconds % 3600) ~/ 60; // Number of whole minutes
String hoursText = (hours > 0) ? '$hours h ' : ''; // Hours text
String minutesText = '$minutes min'; // Minutes text
return hoursText + minutesText;
}
```