Route Terrain Profile
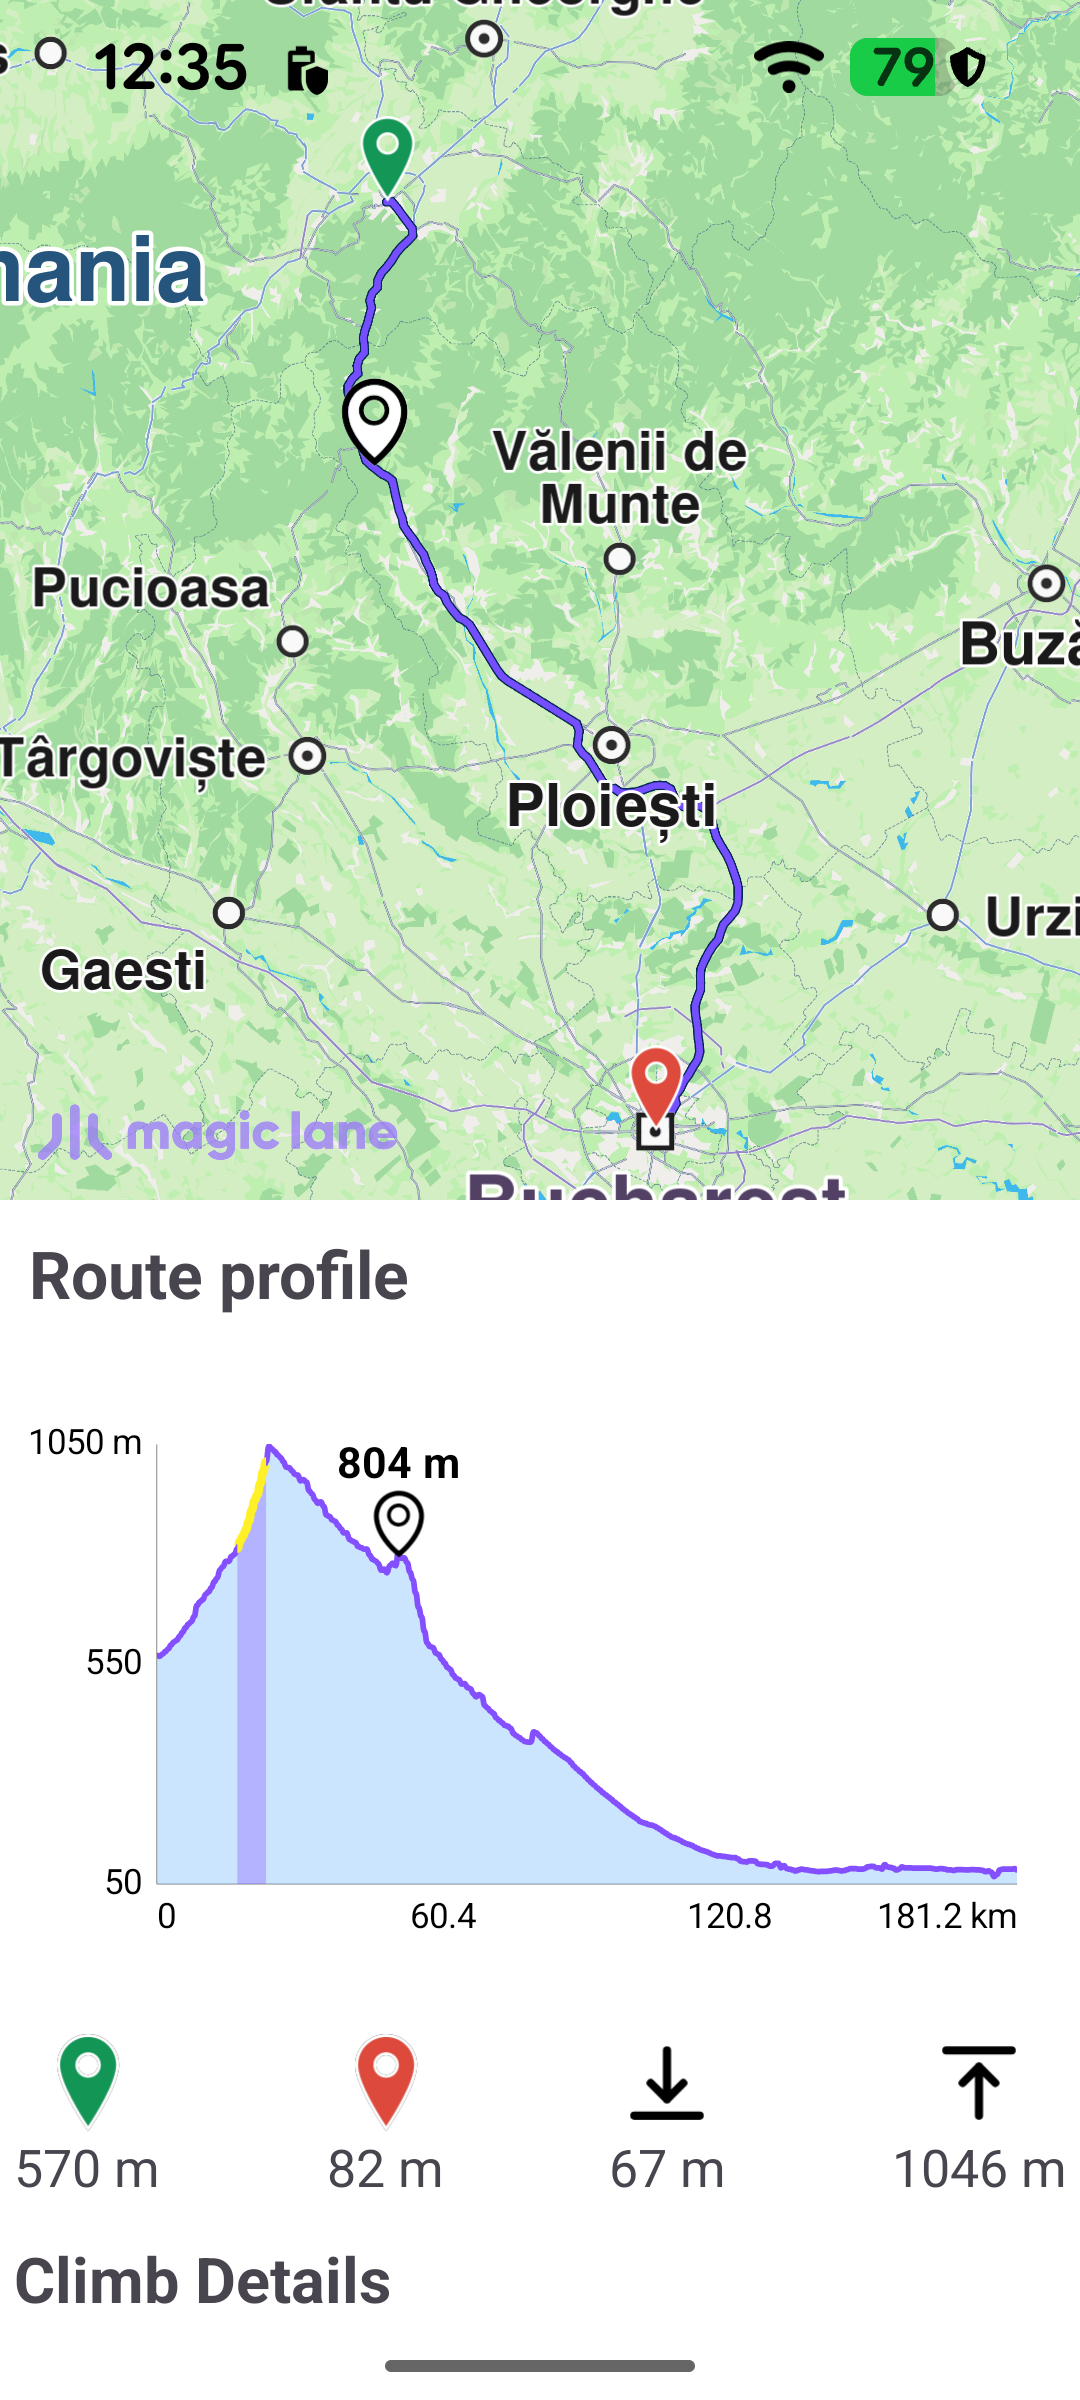
This example computes a route with its terrain profile and presents the elevation and road characteristics in an interactive panel beside the map. The terrain profile describes how the route behaves along its length: the elevation above sea level, the total ascent and descent, the individual climbs (with their rating, length and average grade), and how the distance breaks down by surface type, road (way) type and steepness. Selecting a point or section in the panel highlights the corresponding place on the map, and panning or zooming the elevation chart zooms the route to match.
Enabling and computing the terrain profile
The route is computed with a RoutingService. The terrain profile is not calculated by default - preferences.buildTerrainProfile must be set to true before calling calculateRoute, otherwise the route comes back without any elevation data. The waypoints here run from Brașov to Bucharest.
calculateRoute returns synchronously whether the calculation could be started. When it returns an error the onCompleted callback never fires, so that case is handled right here - the error message is shown in a dialog. A successful start is reported later through onCompleted.
Retrieving the profile from the route
When routing completes, the RoutingService callback inspects the result. Even with buildTerrainProfile enabled the profile can be absent (for example when the SDK has no elevation data for the area), so route.terrainProfile is checked before the panel is shown; if it is missing, a message is displayed instead.
displayTerrainInfo reveals the panel, draws the route on the map, and hands the route to a RouteProfile helper that reads the terrain data and builds the charts.
Reading the terrain data
RouteProfile obtains the RouteTerrainProfile from the route once and reads everything it needs from it. Everything the panel shows comes from this object; the rest of RouteProfile.kt only renders those values with a charting library.
Elevation. The summary values - minimum and maximum elevation (and the distances at which they occur), total ascent and total descent - are read directly from the profile. For the chart itself, getElevation(distanceM) returns the elevation at a single point along the route, and getElevationSamples(count, startM, endM) returns a series of evenly spaced elevation samples between two distances, which is what gives the chart its resolution.
Sectioned data. The rest of the panel is driven by lists of sections, each spanning a range of the route. The profile exposes:
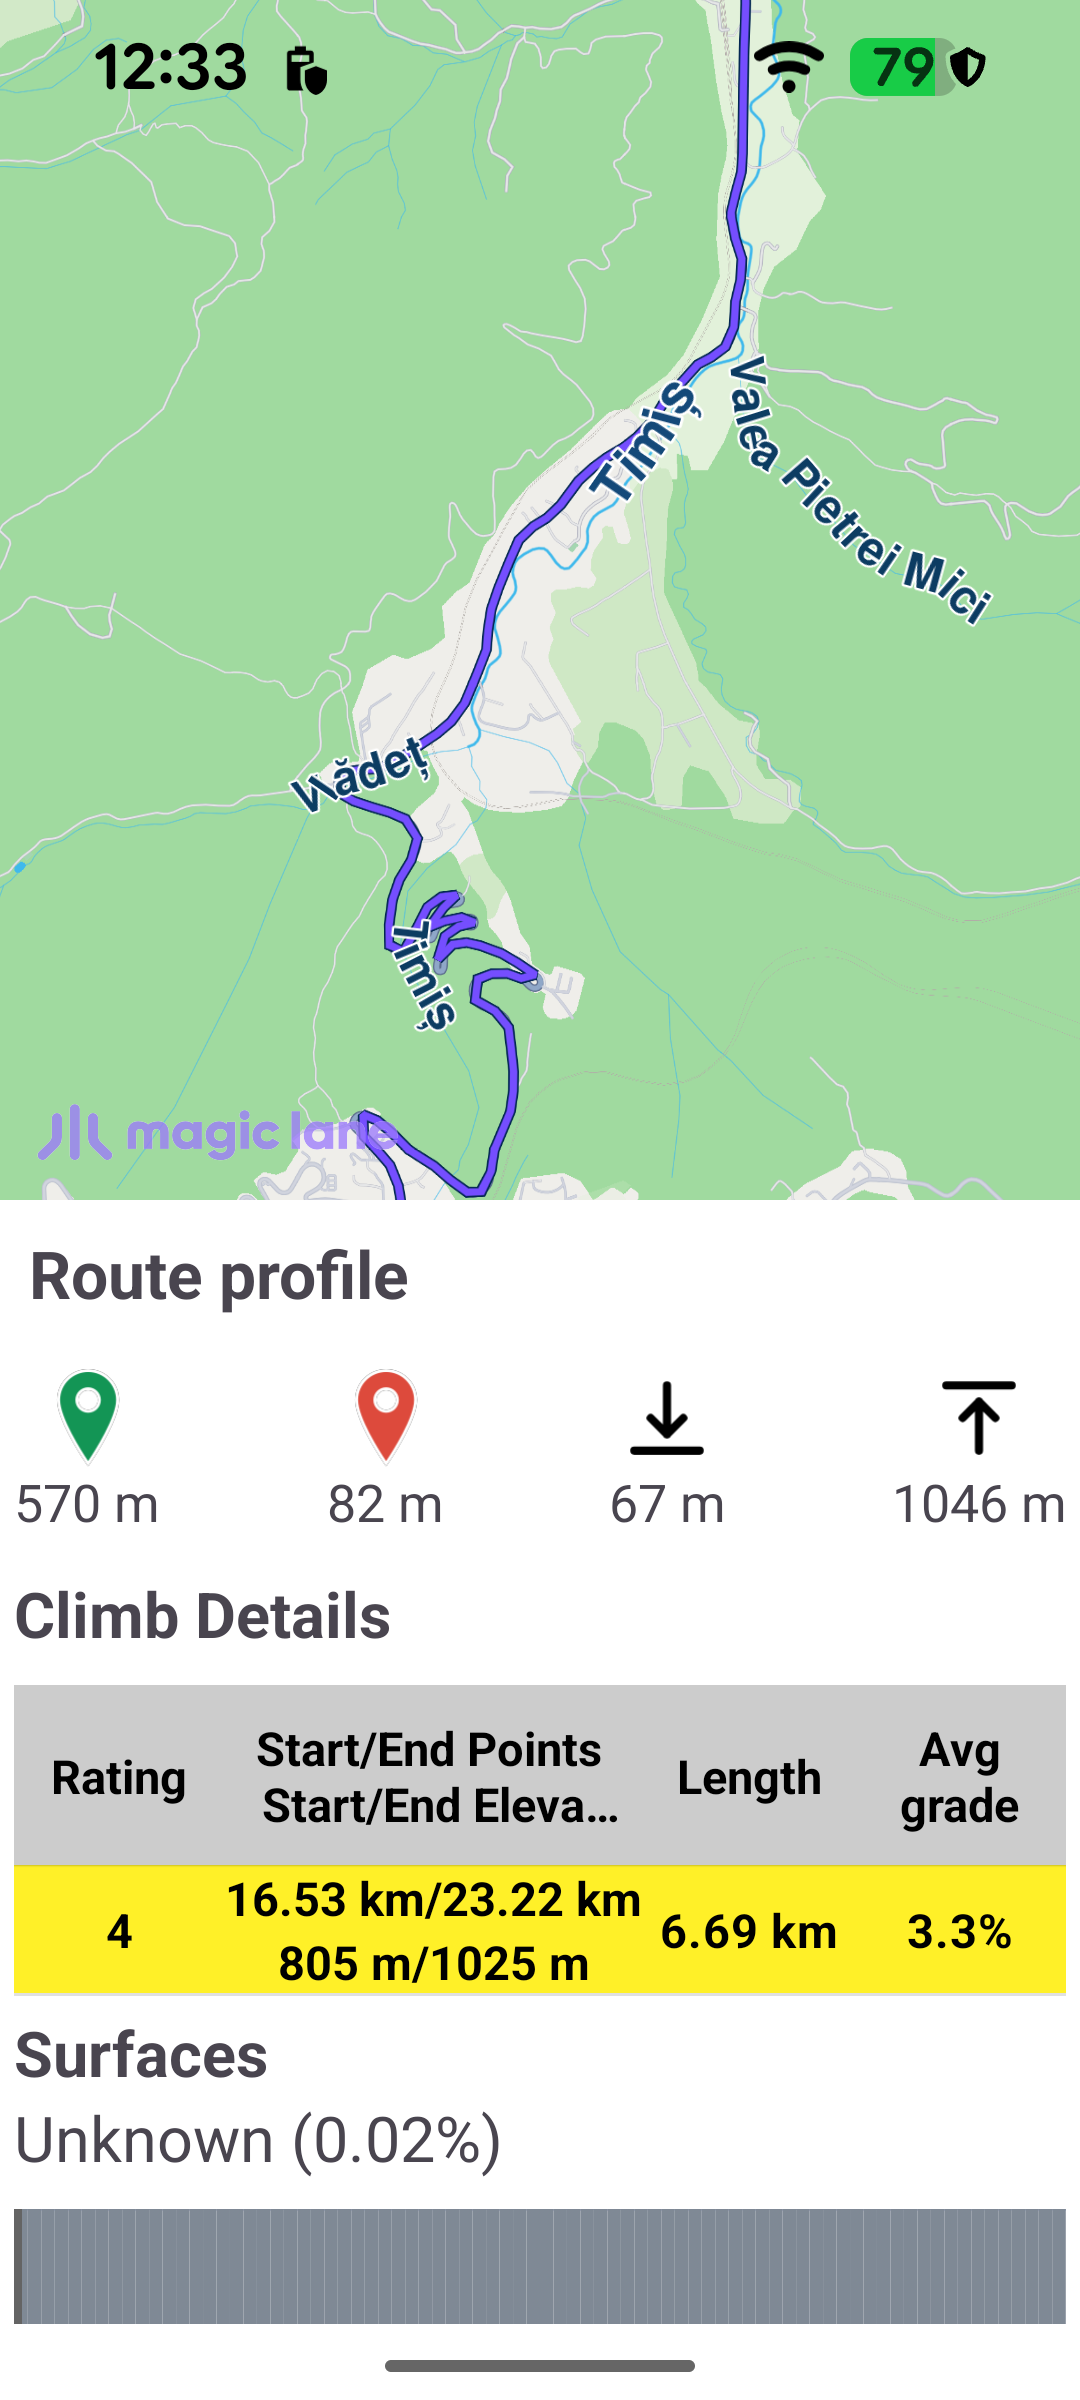
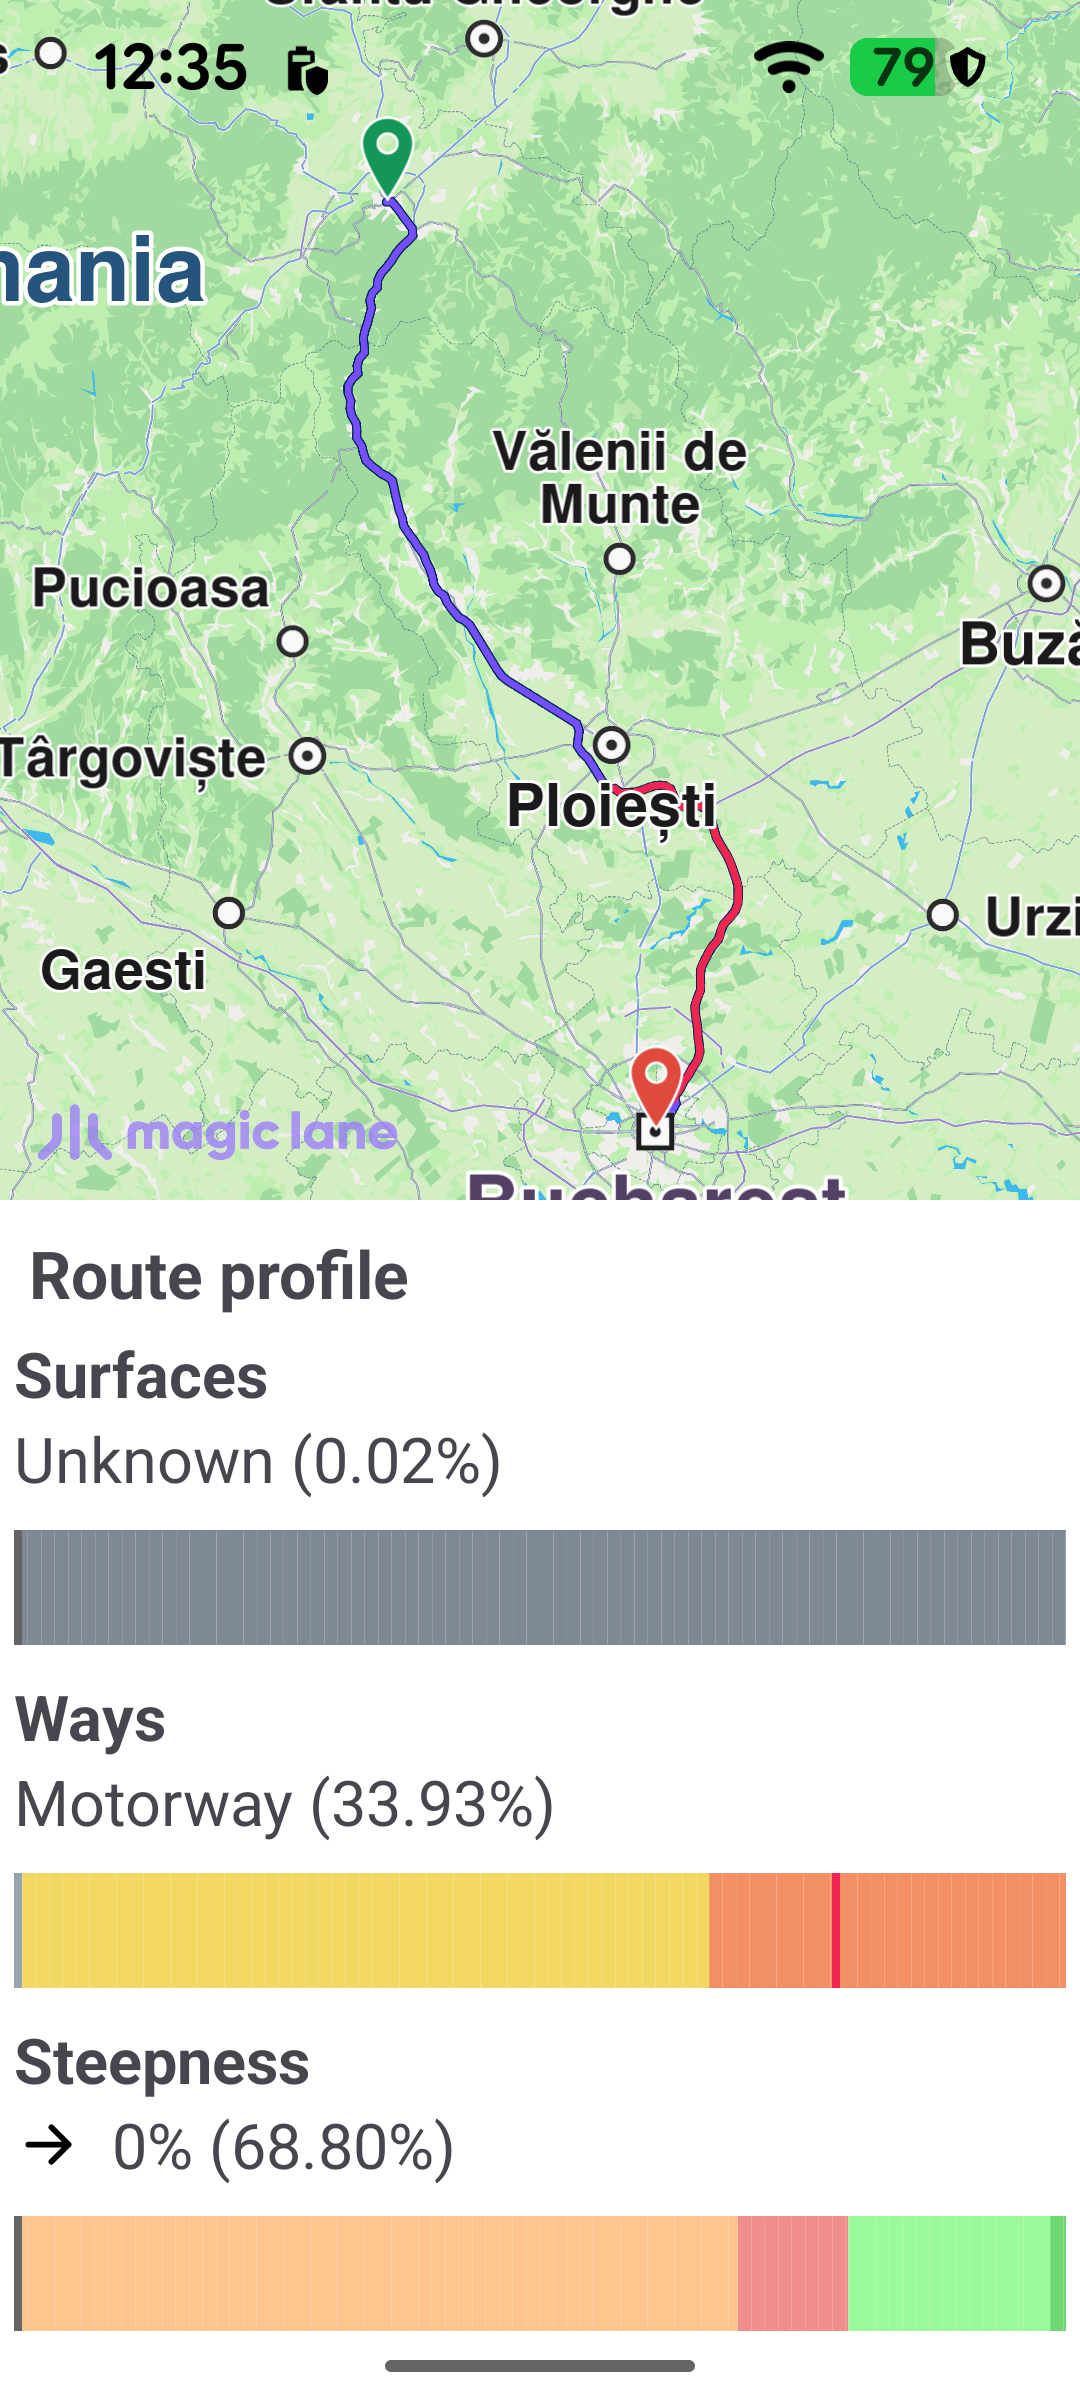
climbSections- the significant climbs, each carrying a rating (grade), start/end distance, start/end elevation, length and average slope. These populate the Climb details table.surfaceSections- the route split by surface type (paved, unpaved, …), summarised in the Surfaces bar.roadTypeSections- the route split by road (way) type (motorway, road, …), summarised in the Ways bar.getSteepSections(intervals)- the route split into steepness categories for the grade thresholds you pass in, summarised in the Steepness bar.
Each section only reports where it begins (startDistanceM), not how long it is. The example derives each section's length by subtracting its own start distance from the next section's start distance; the final section has no successor, so it runs from its start to the end of the route (routeLength).
Map highlighting
The panel drives the map. Touching the elevation chart, tapping a row in the climb table, or selecting a segment in the surfaces / ways / steepness bars highlights the matching coordinate or path on the map (via activateHighlightLandmarks and the map's path collection). Zooming and panning the elevation chart likewise zooms and pans the map to cover the area the chart is currently showing. This panel-to-map behaviour is the bulk of RouteProfile.kt, layered on top of the terrain-profile data described above.