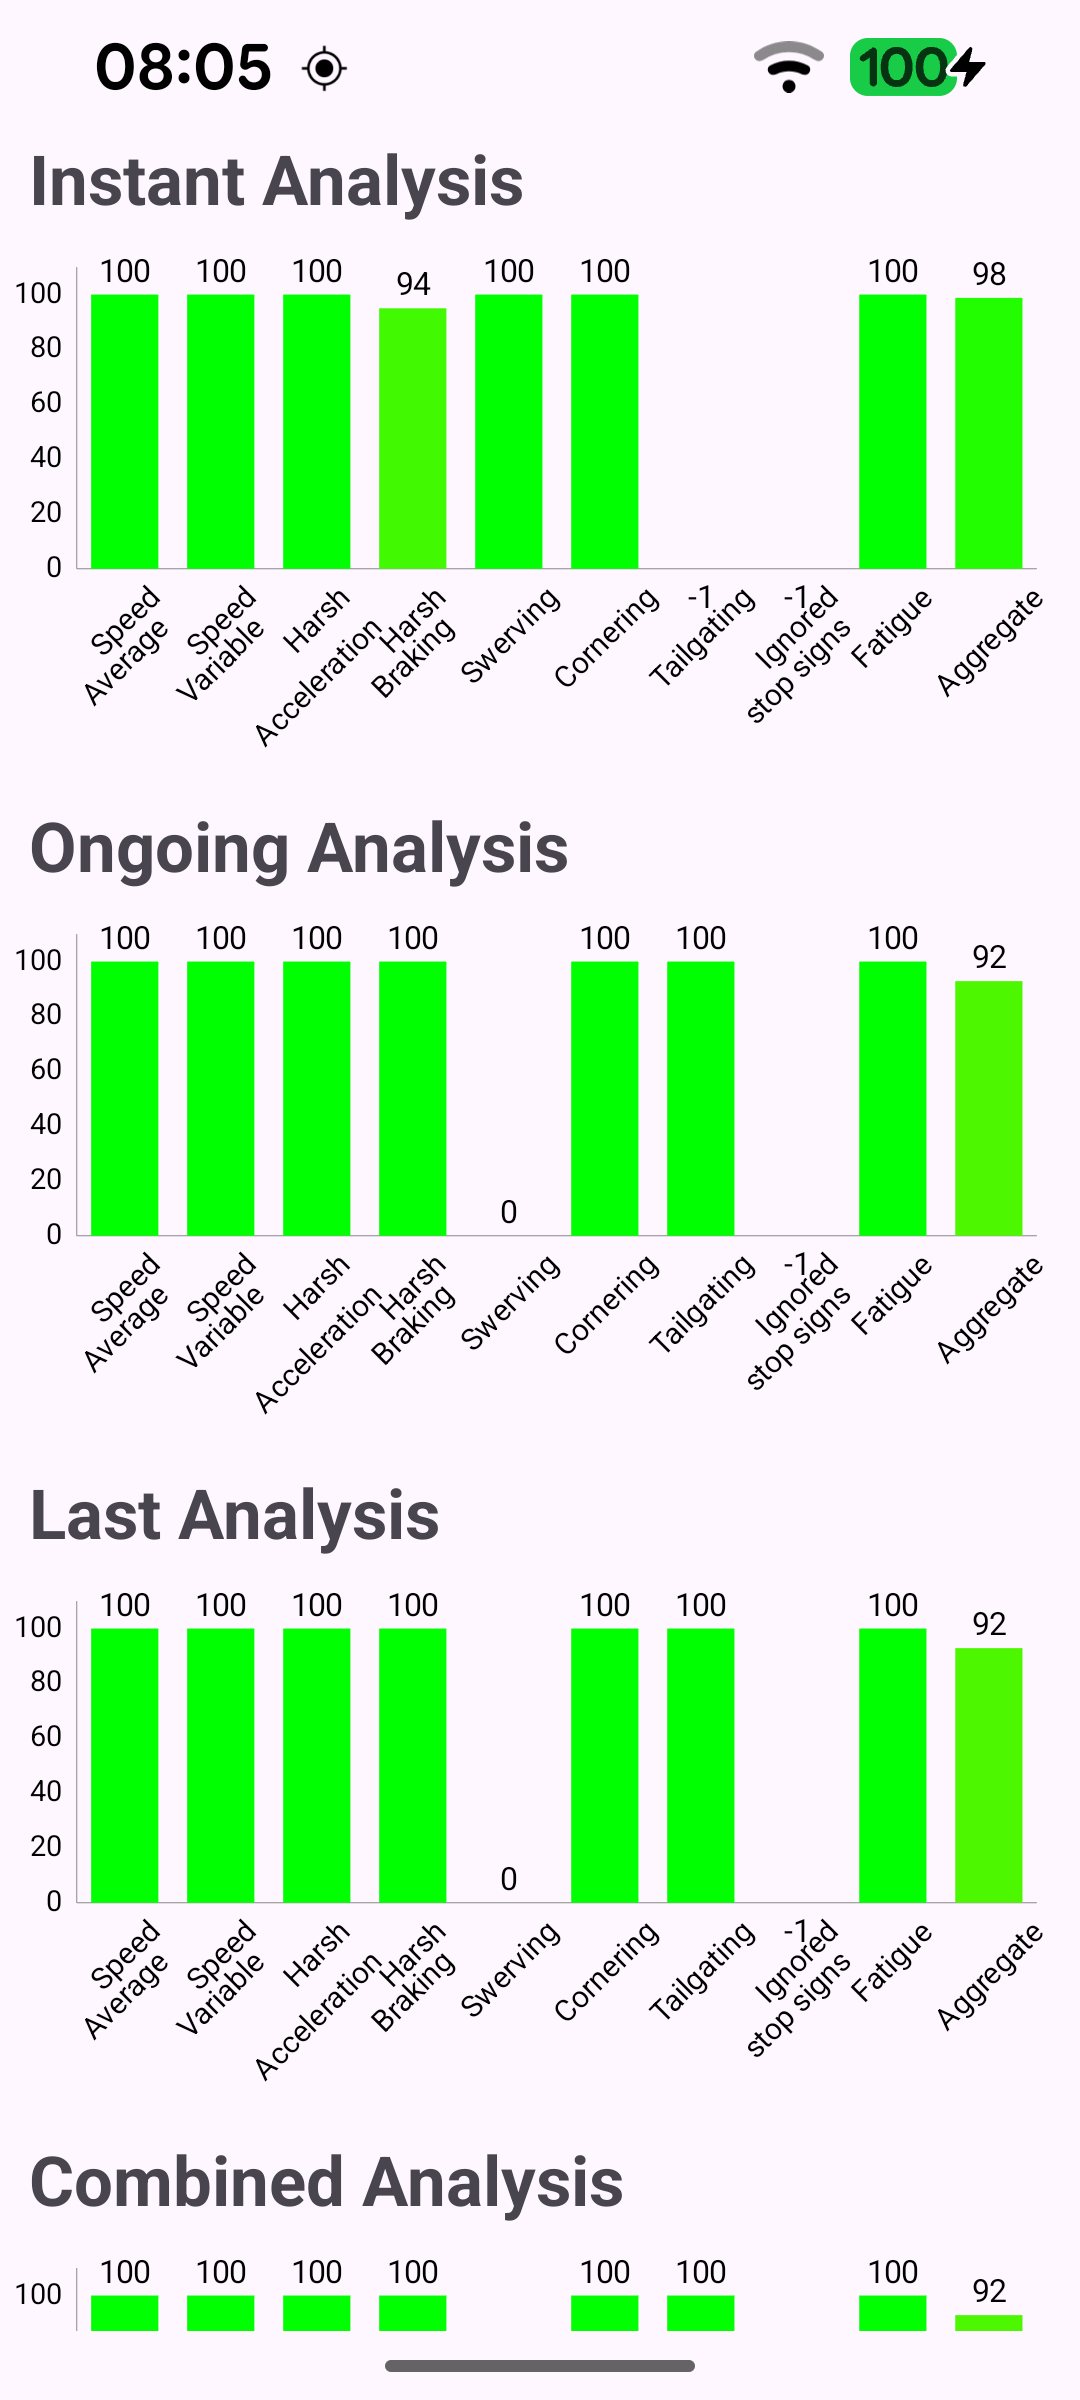
This example analyzes how a vehicle is being driven and displays the resulting driver behaviour scores as live bar charts. Using the device sensors as a live data source, it continuously evaluates metrics such as average and variable speed, harsh acceleration and braking, swerving, cornering, tailgating, ignored stop signs and fatigue, together with an aggregate score. The scores are shown across four charts - Instant, Ongoing, Last and Combined analysis - and each bar is color-coded from red (poor) to green (good) and refreshed every second.
The analysis only starts once the worldwide road map is ready. A live DataSource is produced from the device sensors, a DriverBehaviour instance is produced from it, and startAnalysis begins evaluating the driving. A repeating timer then refreshes the charts once per second.
Every tick, the latest scores are read from the DriverBehaviour instance. The SDK exposes four flavours of DrivingScores: the instantaneous scores, the ongoing analysis, the last completed analysis, and a combined analysis computed over an arbitrary time interval.
Each DrivingScores object is turned into a list of BarEntry values - one bar per metric - which feeds the chart. The order matches the chart labels (Speed Average, Speed Variable, Harsh Acceleration, Harsh Braking, Swerving, Cornering, Tailgating, Ignored stop signs, Fatigue, Aggregate).
When the activity is destroyed, the timer is cancelled and the analysis, driver behaviour instance and data source are all released to free the underlying sensor resources.